Well this is one label style with which I've been wrestling for some time. Then while creating an offset label style the other day, it just hit me how easy it would be to get the two flowline elevations into one style. Now, at this point, the pipe size in this particular style has to be edited manually, but maybe this style might give you some ideas on how to get everything you want labeled automatically.
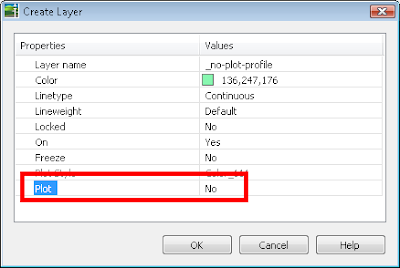
The first thing you need to do is create a profile style with Line, Circular Curve, Symmetrical Parabola, and Asymmetrical Parabola component types visible, but on a "no-plot" layer. For my style, I've create a layer called _no-plot-profile and set the Plot property to "No".

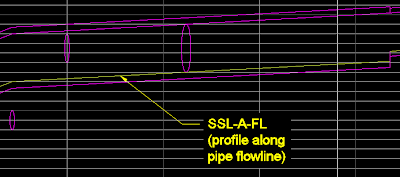
Now create a profile by layout that follows the flowline of the main pipe in your profile view. Be sure to use the "no-plot-profile" style that you just created. This profile can also be used to label your pipe flowline elevations (such as the elevations shown in a band style).

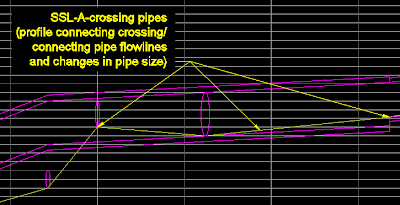
Now create a second profile by layout that connects the flowline of all your crossing or connecting pipes. You can also tag the end of the smaller pipe at a pipe change (since a profile can't be exactly vertical). The second profile should look something like this:

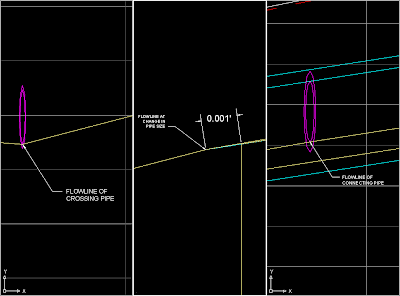
Here's a zoomed in view of the three major locations where I use the "crossing pipe" profile. (Just click on the image to see an enlarged view.)

Well, that's it for Part 1. In Part 2, I will describe how to create the Profile View Station Elevation Label Style.

Không có nhận xét nào:
Đăng nhận xét