Hiển thị các bài đăng có nhãn Labels. Hiển thị tất cả bài đăng

Thứ Sáu, 29 tháng 8, 2008

Offsetting a Profile View Label - part 4

This is Part 4 of a series on Profile View Label Styles (PVLS). This post may not make a whole lot of sense if you haven't seen the previous posts in this series. Please take a moment to read them before continuing to read this one. Here's a link to each:


PART 1: Creating Profiles for Labeling Crossing or Connecting Pipe Flowline Elevations

PART 2: Creating the Style for the Connecting Pipe Flowline Elevation Label

PART 3: Labeling the Crossing or Connecting Pipe Flowline Elevations

To use the Offset Style created in this series, you'll need to create the label style first. (Instructions for creating an offset label style can be found Part 2 of this series.

After the style has been created, right click on the style and select New... in the Settings tab of the Toolspace. For Profile Views, this will create a "Child" of the original style. It will have all the same properties and components of the original style at the time that it is created except those that you change.

On the Information tab, rename the text inside the brackets [child] to [RT-0.3]. That means that we will be creating a style that moves the text right 0.3 inches. Go ahead and left click on Apply then select the Layout tab.

Remember how we deleted the original text so that the first component was "Line for Text". This is where it comes into play.

Go to the Line section and change the Start Point X Offset to 0.3, then Apply and OK. Now place the style in the drawing or change one of the existing labels to use this style instead. Here's a screen capture of the original parent style and the new offset RT child style.


There are other ways to change the style as well. Try changing these values and see how they affect the style:

  • The length of the "Line at Insertion Point"
  • The length of the "Line for Text"
  • The Start Point Y Offset of the "Line for Text"
You should never change the values of the "Offset Connection Line", because they will always follow the start/end of the other lines in the style.

Well, that's it for my series on Profile View Label Styles. I hope you found it useful. Feel free to post a comment if you have questions or if you just want to request a topic for a future post.

Creating Profiles for Labeling Crossing or Connecting Pipe Flowline Elevations-part 3

This is Part 3 of a series on Profile View Label Styles (PVLS). You should also read Part 1 and Part 2 of this series for additional information.

To label a crossing and/or connecting pipe flowline elevation, you'll need the style created in Part 2 of this series and profiles for both the main line and the crossing/connecting pipes as described in Part 1 of this series.

After you have the style and profiles created in your drawing, the rest is really simple.

  1. Zoom into the connecting pipe that you want to label.
  2. From the Civil 3d Profile menu, select "Add Profile View Labels", then "Add Profile View Labels...".
  3. In the Add Labels dialog box, select the style that you created from Part 2 of this series (mine was called Connecting Pipe Label).
  4. Choose a Marker style if you want one. I don't generally use one for this style.
  5. Left click on the Add command button.
  6. You will be prompted to select a profile view. Select the profile view by left clicking on one of the grid lines, not the actual profile.
  7. When asked to specify a station, select the endpoint at the flowline of the crossing pipe shown in the profile view.
  8. When asked to specify an elevation, you can either select the same point or specify an elevation for the insertion point of the label.
  9. Repeat this process for other connecting pipe labels that are visible in this profile view.
  10. If you need to add labels in other profile views, you'll need to left click on the Add command button again to select a different profile view.
So now the label is placed, but there aren't any elevations shown. Here's the secret:
  1. Select all the connecting pipe labels in one profile view and then look at the properties listed on the labels. There is a Civil 3D section that contains a listing for Profile1 Object and Profile2 Object. They will be set to by default.
  2. Left click on the for Profile1 Object and set that to the profile you created for the flowline of the main pipe.
  3. Left click on the for Profile2 Object and set that to the profile you created for the crossing and/or connecting pipes and pipe size changes.
Now you have the flowline elevations and all you have to do is editlabeltext on the style to change the name of the utility line and modify the pipe sizes. As I said in my first post, I'm sure you can take this style further to get the pipe sizes in it. Also, you would need to make a copy of the style and modify the text for grade breaks, and crossing pipes.

Well, that's it for Part 3. In Part 4, I will describe how to use the offset capability that we put in place when we created the Profile View Station Elevation Label Style in Part 2 of this series.

Creating Profiles for Labeling Crossing or Connecting Pipe Flowline Elevations-part 2

This is Part 2 of a series on Profile View Label Styles (PVLS). You can view Part 1 of the series here.

Here's the step by step guide to creating the Station Elevation Profile View Label Style. The way this style is created will enable you to easily establish offsets in child styles as needed. That will be explained in a Part 4 of this series.

  1. If toolspace is not visible, type showts at the command line and press enter.
  2. Select the Settings tab.
  3. Double click "Profile View" in the list under your current drawing name.
  4. Double click "Label Styles".
  5. Right click "Station Elevation" and select "New...".
  6. On the Information tab, type a name for your style. I'll use Connecting Pipe Label for this example.
  7. On the General tab, set the layer as required. I'll use PROF-VIEW-TX for this example.
  8. On the Layout tab, delete the default "Station & ELevation" component (yes, the "L" is really capitalized) that is created by clicking on the near the top middle of the Label Style Composer dialog box. I do this because I want a different component to be the first one that appears when the Layout tab is selected in the future.
  9. Select Line from the Create Component dropdown list.
  10. Under the General section:
    1. Change the Name property to Line for Text,
    2. Set the Start point anchor point to Middle Center.
  11. Under the Line section:
    1. Change the Length to 2.0000",
    2. Set the Angle to 270° 00' 00",
    3. Set the Start Point Y Offset to -0.5000". This moves the beginning of the line down 0.5 inches from the point you select for placing the label.
  12. At this point, you're probably looking at the preview side of the Label Style Composer dialog box to see how things are looking. Unfortunately, the default preview state for a Profile View Station Elevation Label is set to Depth Label Style. So click the drop down arrow near the upper right corner of the Label Style Composer dialog box and select "Station Elevation Label Style" to watch the style update as you apply the changes.
  13. At this point, go ahead and select Apply so that everything up to this point will be saved.
  14. Create another line component (same as step 9).
  15. Under the General section:
    1. Change the Name property to Line at Insertion Point,
    2. Set the Start point anchor point to Middle Center.
  16. Under the Line section:
    1. Change the Length to 0.2500",
    2. Set the Angle to 270° 00' 00".
  17. Now create one more line component (same as step 9). This may seem unusual, but it will make sense at the end of the post.
  18. Under the General section:
    1. Change the Name property to Offset Connection Line,
    2. Set the Start point anchor component to Line at Insertion Point,
    3. Set the Start point anchor point to End,
    4. Set the Use End Point Anchor to True,
    5. Set the End Point Anchor Component to Line for Text,
    6. Verify that the End Point Anchor Point is set to Start.
  19. Select Apply again to save the changes up to this point. The preview tab will show that the label currently appears as if there is just one solid line.
  20. Create a text component from the create component list.
  21. Under the General section:
    1. Change the Name property to Station and Flowline Text,
    2. Set the Start point anchor point to Line for Text,
    3. Set the Anchor Point to End.
  22. Under the Text section:
    1. Edit the Contents as follows:
      1. On the format tab, set the Justification to Left,
      2. Insert text appropriate for the style you are creating. For my example, I used this text:
        STA <[Station Value(Uft|FS|P2|RN|AP|Sn|TP|B2|EN|W0|OF)]> SSL-XX=
        STA 1+00 SSL-XX
        FL (XX")=<[Profile1 Elevation(Uft|P2|RN|AP|Sn|OF)]>
        FL (XX")=<[Profile2 Elevation(Uft|P2|RN|AP|Sn|OF)]>
        I also force the XX values to a different color so that I know that these values have to be manually edited and updated as required. It ends up looking something like this:
    2. Set the Attachment point to Bottom Right (Don't ask me why. I think it should be set to Top Left, but once the text is perpendicular to the view, it seems that you have to set it to the opposite of what you think it should be.)
  23. Apply, OK, and your style is complete.
Well, that's it for Part 2. In Part 3, I will describe how to place the Profile View Station Elevation Label Style that you just created.

Creating Profiles for Labeling Crossing or Connecting Pipe Flowline Elevations-part 1

This is Part 1 of a series on Profile View Label Styles (PVLS). I will discuss how to label the flowlines of connecting pipes in a profile view. Armed with this information, you should be able to create your own style that shows flowlines of pipes at crossings and at changes in pipe sizes.

Well this is one label style with which I've been wrestling for some time. Then while creating an offset label style the other day, it just hit me how easy it would be to get the two flowline elevations into one style. Now, at this point, the pipe size in this particular style has to be edited manually, but maybe this style might give you some ideas on how to get everything you want labeled automatically.

The first thing you need to do is create a profile style with Line, Circular Curve, Symmetrical Parabola, and Asymmetrical Parabola component types visible, but on a "no-plot" layer. For my style, I've create a layer called _no-plot-profile and set the Plot property to "No".


Now create a profile by layout that follows the flowline of the main pipe in your profile view. Be sure to use the "no-plot-profile" style that you just created. This profile can also be used to label your pipe flowline elevations (such as the elevations shown in a band style).


Now create a second profile by layout that connects the flowline of all your crossing or connecting pipes. You can also tag the end of the smaller pipe at a pipe change (since a profile can't be exactly vertical). The second profile should look something like this:


Here's a zoomed in view of the three major locations where I use the "crossing pipe" profile. (Just click on the image to see an enlarged view.)


Well, that's it for Part 1. In Part 2, I will describe how to create the Profile View Station Elevation Label Style.

Thứ Tư, 20 tháng 8, 2008

Label Those Lot Lines

Do you ever have the need to label lot lines in Map3D? Civil3D users have the parcel labels but with just Map3D it was always the old text command. Try using the map annotation block features instead. Here’s how you can create a annotation template that makes it a little easier. First the lot or parcel lines need to be lines or single element plines. So if you need to use the drawing cleanup tool first to break those polygons or closed plines into single element plines.
We start with creating an annotation template then use the property value “Length” for the value for our length tag. But we need to add a few extras to make it look right. First thing we don’t want all the labels to be 8 decimal places long, two is the standard most places, and second we need to add the FT (single quote) mark at the end.

length_tag

So to accomplish this the value should look like this
(STRCAT (RTOS .LENGTH 2 2) “‘ ” )
The RTOS converts the real (Length) value to a string value with the first 2 being the units type as Decimal and the second 2 as the precision. The STRCAT and the “‘ ” (double quote, single quote, double quote) then takes that length value and adds the single quote mark at the end. If you work in Meters you can replace the single quote with Meters, just make sure you keep it inside the double quotes. For the text options use your text style you need and for the height use the value that will meets your standards. Keep the rotation at 0 but set the justification at Middle Center. Use you own standards on the object properties for layer,, color and lineweight.
When you click OK and are asked for” Specify middle-center of text: ” go with 0, “your text height” this places the tag at it’s proper location with the justification at middle center.
Now for the bearings part of the annotation. Start a new annotation tag and for the value we use the angle property of the line but convert it to a string.

Bearing_tag

We do this because the angle property returns the angle in Radians not in degrees. So the value will be (ANGTOS .ANGLE 4 3).
The ANGTOS converts the radian value to a string and the 4 tells it what angle type to use in this case Surveyors and the 3 is the precision, taking it all the way down to seconds. Set the text options the same as for the length tag and the object options to your standards. This time when you are asked “Specify middle-center of text:” use 0, - “your text height”, to place it below the length tag.
Save your template and use the annotation tools in Map3D to label your lot lines. When you insert the annotation blocks is when you need to set the rotation value so use the expression .ANGLE to set it. Doing it here makes for cleaner labels and keeps the two lines aligned.

Rotation

Now for a couple of disclaimers: The annotation angle will be in the direction that the line was created. Most surveys start at the POB and go around in one continuous path. The labels need to follow that rule, that’s the way I was taught years ago and that’s the way I taught for years. However if your drawing is from a source that doesn’t follow that rule or you used the drawing cleanup tools the line may not be drawn in the proper order and will need to be adjusted. Another thing is the text may be upside down or on some of them the length is on the inside with the bearing on the outside while others are vise-versa. By setting grips enable for blocks and using the two tags instead of a multiline attribute tag allows you to move and adjust the placement as needed.

Labels

The Finished project.


viewmore

Displaying cut/fill labels

For those of you that don't know who he is, Peter, among other things, is the newest Product Manager for Civil 3D. He has a programming background, and before the recent switch to his current title, was the API Product Manager for Civil 3D. Anyway, he's too smart for his own good sometimes, but it's great for us, because we can reap the rewards.

This tip is solely Peter's doing, and I can neither confirm nor deny any of the credit!

Displaying cut/fill labels with appropriate colors.

Surf_Label_001sm.png
View image

Here is the end result of this tip. Note that the cut volume labels are red, and the fills are green, and they are each inserted on a grid.

Here is how to do it:
1. Create a volume surface that represents the two surfaces you are comparing

2. Create an expression for Surface Spot Elevation labels
- Name it "Negative Value"
- Use this expression; -1 * {Surface Elevation}

Surf_Label_003sm.png
View image

This expression will take a value, and multiply it by negative one, changing a positive integer into a negative one, or for this case, taking a negative and turning it into a positive. The ole double negative trick!

3. Create a new Surface label style for Spot Elevation Called "Cut Fill"

- Rename the label Component to "fill"
- Change its color to Green
- Modify the Surface Elevation label component
- Edit the text component and change the Sign Modifier to "Hide Negative Value"

Surf_Label_002sm.png
View image

4. Make a new component for the Cut value
- Copy the Fill text component
- Rename to Cut
- Change the color to Red
- Edit the Text Component, and replace with the Negative Value expression
- Change the Sign Modifier to "Hide Negative Value"

Surf_Label_004sm.png
View image

Now add Surface labels to the Volume surface on a grid, using the Cut Fill style. All the spot elevation in a cut area (the negative values from the volume surface) will be labeled with the Red label, and all the spot elevations with a fill area (where the volume surface is positive) will label with the green text. Because we chose to hide the negative values, and we used an expression to turn a negative into a positive (the cut), it automatically display the appropriate spot elevation.

Surf_Label_005sm.png
View image

view more

"Deleting Multiple Surface Labels"

Every now and then we stumble across minor quirks in the program that will make it do undesirable things, like shut down. My post is not intended to discredit the program but to let people know about the issue and how to work around it. If for some odd reason you would like to replicate it follow the below steps.


1. Save your drawing!
2. Under Surface, Labels, Add Surface Labels
3. Add 4 or 5 labels to a surface, using Slope as the Label Type (only 2 are required)
4. Start the Erase command and select the 1st label, as you select the second label you will notice that the program will shut down unexpectedly.


This is just a minor flaw but I thought it was serious enough to share it with everyone out there. I guess the solution to it is to delete them one at a time. Also, I have noticed that it is only specific to the Slope Label Type. Just to be sure I have tried creating other label styles under the Slope Label Type and have had the same result.

I cannot take full credit for the finding but I can definitely replicate it. Autodesk has been notified and hopefully we will see a fix in the near future.

view more

Thứ Năm, 7 tháng 8, 2008

Critical Labels

Picking up were I left off yesterday, let's label all these critical points. Before I do though, I'd like to thank Angel for posting about my new blog. Thanks!

Labeling Critical Points
None of the out of the box labels really work the way I would like them to, but that doesn't mean that AutoDesk didn't provided the tools to make a label like I want!

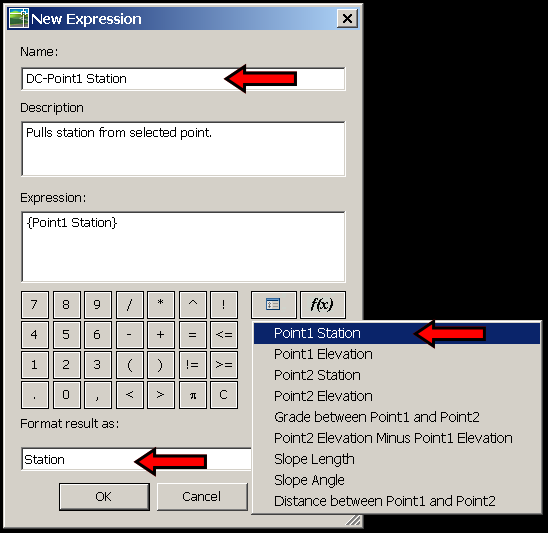
Let's start by making some new expressions. No, it's not a mistake, I am making the expressions under the Depth label category, even though I will eventually be labeling a station and elevation. Why? Because I like the look and feel of the depth label, it just doesn't label what I want it to...out of the box.


Two expressions need to be created. One for the station of the selected point and one for the elevation of said point. Pay close attention to the format that the results will displayed as. Now is a good time to extend your cad standards and naming convention to expressions.

Station Expression:


Elevation Expression:


Now that we have the expressions built, let's combine then into a label that we can use.

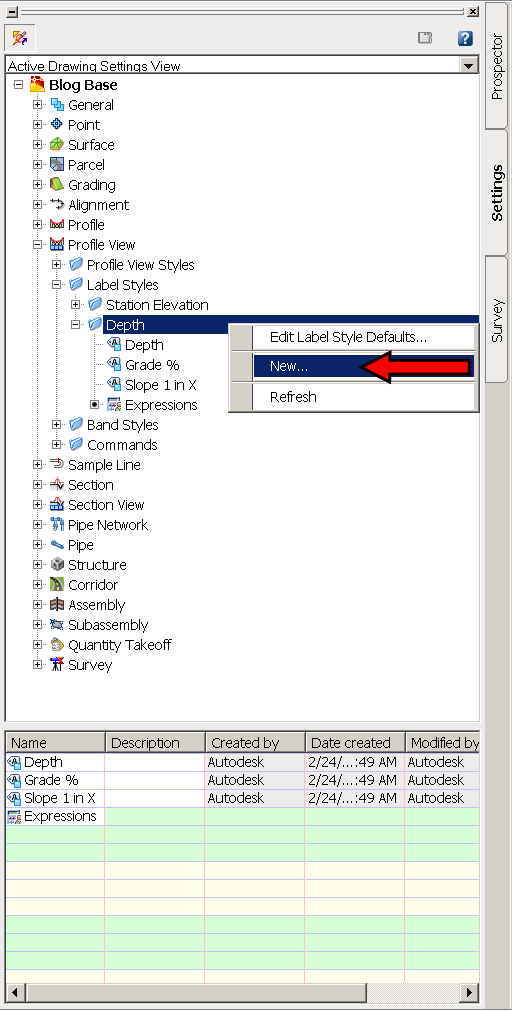
First, create a new label:


Now, let's format the label to take advantage of the new expressions:


After creating the new label style, it's time to label the critical points on our subject profile.
Profiles>Add Profile View Labels...

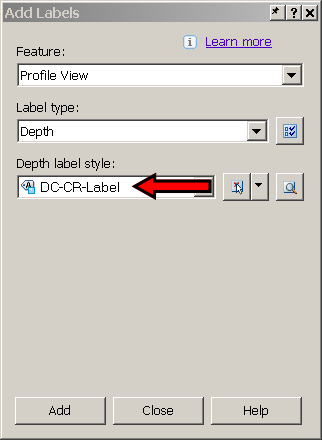
Now select the newly composed label:


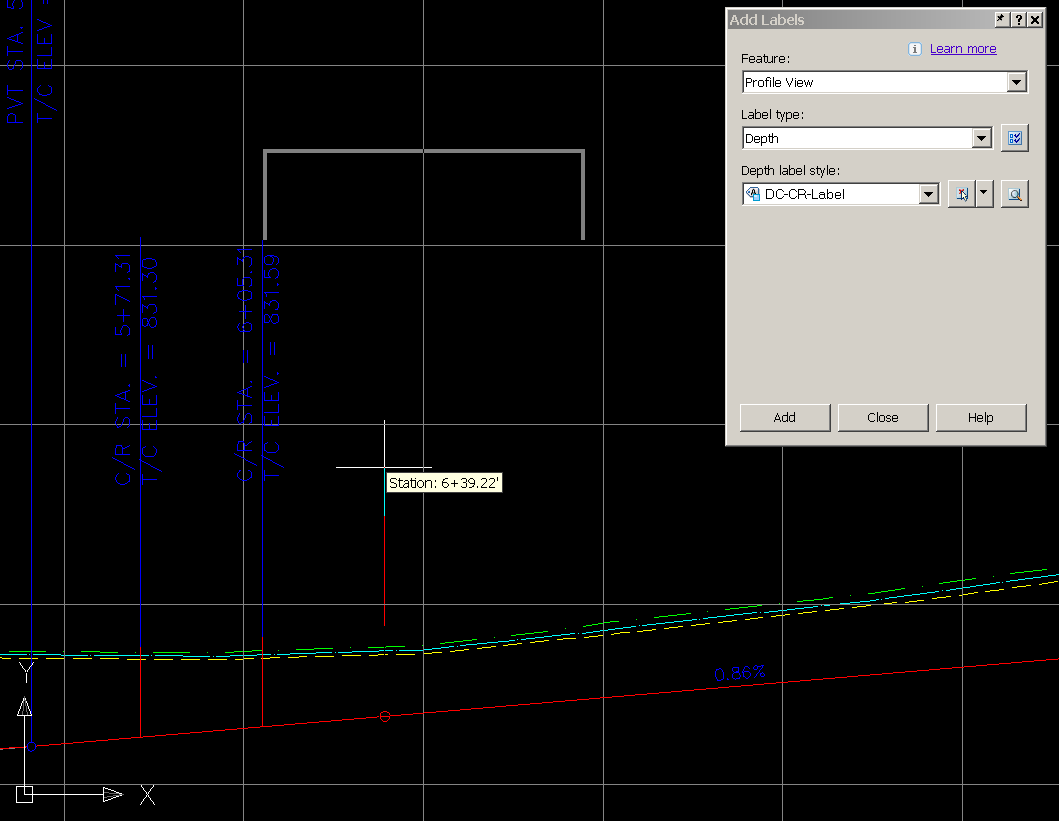
Adding the labels to the profile view is a breeze now that we have nodes to snap to (if you don't remember putting nodes on the profile, re-read yesterday's post). Simply snap onto the node of the various points and drag in the direction you want the label.


As a final cleanup, change the marker style of the "CR" point group to "none"


Now we have labeled all the curb returns, intersections, and any other critical stations without offseting or drawing any line in our profile view. Also, there was no need to label a single critical station in plan view for future reference!

Thứ Tư, 6 tháng 8, 2008

Multiple Contour Labels

We here at KETIV Technologies recently received an inquiry as to whether or not it was possible to label contours lines with many labels at once, similar to how Land Desktop does it. The following information was prepared and contributed by Daniel Granillo, a co-worker here at KETIV.

Create Multiple Contour Labels like in Land Desktop using Civil 3D
Procedure:
1. Click Surfaces menu > Labels > Add Contour Labels
2. On the "Create Contour Labels" toolbar, select "Label Multiple Group Interior"

Note: This will enable the Multiple Group Interior edit box where you enter the desired spacing interval.

3. Enter a desired distance for the spacing interval in the field provided

4. Select a start point and endpoint for the contour label line.
5. Repeat Step 4 as needed
6. Press Enter to end the label creation process.

Tip: After creating your contour labels, you may want to turn-off the label line layer and/or make it non-plot-able (By default the contour label lines are placed on the DEFPOINTS layer).

More on Civil 3D Labels

A few months ago, I began to define a Pin and Parcel Area label. The initial steps of defining a label occur in the Label Style Composer dialog box. This dialog box contains the Information, General, Layout, Dragged State, and Summary tabs. I also looked at the Layout tab and described its settings in detail. In September's column, I reviewed a label's dragged state settings and the Parcel's display order for line work. This month's "CAD Clinic: Civil 3D" installment concentrates on exploring label styles, labeling multiple occurrences, and discussing pipe network structure labels and label sets.

Pipe Network Text for Each
A Pipe Network Structure label has a special Layout component type called Text for Each. Text For Each creates a label entry for each structure's incoming and outgoing network pipe. The label's component name identifies the label's text contents as incoming and outgoing pipes.

figure

The Structure Properties dialog box lists connected pipes and identifies them as in or out. The pipes in the list are content for the label's Text For Each property. The in and out designation allows the label to correctly document a structure's pipes.

figure

Complex Labels -- Sag and Crest
A Civil 3D label can contain lines, dimension lines, and blocks as well as text components. The Profile Curve Label Style, Crest and Sag, is an example of a label style that contains multiple component types.

figure

This label style uses vertical lines at the start and end of the vertical curve and connects them with a horizontal dimension line to construct the basic label structure. The start line attaches to the PVC of the vertical curve and ends at the dimension line. The end line attaches to the vertical curve PVT and ends at the dimension line. This structure allows the start line to stretch to accommodate any vertical location of the dimension line and for the dimension line to accommodate changing PVC and PVT points. These three lines create basic reference lines for the text components of the label style.

figure

The remaining label's text references the start, end, and dimension lines. The text component referencing the start and end lines attaches to the intersection of the dimension and start / end line. Because the text attaches at the middle right of the text, there's an offset spacing from the text to the line. As the text changes, it holds the upper end of the text and forces the text to move down towards the profile it labels.

The parent style, Crest and Sag, defines the line work and text placement. The child styles define the label specific to a sag or crest vertical curve.

figure

Label Sets
Label sets are aliases for styles that contain a list of label styles for alignment, profile, and section objects. You assign a label set when defining the object. The figure below shows the alignment label set value for the Create Alignment - from Polyline command. Creating a label set is a two step process. First, you must define set style types, and second, you must define the label set and identify its styles.

figure
The Alignment label set value for the Create Alignment - from Polyline command.

Alignment Label Sets
Civil 3D's Alignments Label Set annotates specific locations and stations along the path of an alignment. Each label type contains a list of label styles for that type. The label types are major and minor stations, geometry points, station equations, design speeds, and profile geometry points. The increment value for stations is independent of the profile and band labeling increment.

figure

The Alignment Label Set styles are in the Label Styles branch of Alignment under the Station branch. The headings of the Station branch are the label types used by an Alignment Label Set.

figure

Profile Label Sets
The Profile's Label Set branch identifies the available label sets, and the remaining branches identify the label types used by a label set.

figure

The Profile Label Set label style types are major and minor stations, horizontal geometry point, grade breaks, line, and curve.

figure

The major and minor station labels create labels of profiles' stationing in profile views. The horizontal geometry styles label the curves and spiral points of the horizontal alignment on selected profiles. The styles of the grade breaks branch annotate profiles' PVI. The styles of the line branch annotate the slopes (grades) of a vertical tangent segment. The curve branch labels the crest and sag vertical curves. These labels can be used with either surface or vertical road design.

The placement of a label in relation to the profile view is from the settings in the Profile Label Set definition. The Label Set's Dim anchor opt column sets the location of the label. The location can be one of five choices: distance above or below (the feature), fixed elevation, or graph view top or bottom. The distance above and below is relative to the feature. The graph view top or bottom, and the fixed elevation options are locations in the profile view. The weeding value prevents labels from overlapping.

figure

Section Label Sets
Civil 3D's Sections Label Sets are similar to profile's sets; however, they annotate only surface values in a section. A Section Label Set can contain major and minor offsets, grade breaks, and segment labels.

figure

The major and minor offset labels annotate offsets and their elevations at the offset at the increment defined by the Label Set. The labeling increment for these labels is set in the Label Set style. The grade break label annotates elevations at each grade break point of a section surface. The Segment labels annotate the slopes between each grade break segment. You should set a weeding value to eliminate grade break and segment labels from overlapping. The weeding distance is set in the Label Set Style.

figure

Complex Objects
For complex objects, Civil 3D has complex labeling options and style constructions. An example of a complex labeling option is annotating in and out pipes. The structure label uses a structure's properties to create the in and out pipe properties and the label's Text for each option. This label option scans a structure's properties for pipe connections and creates a label entry for each pipe.

An example of a complex label construction is the profile's Crest and Sag label. The label has 10 label components. The label style's lines are connected to each other creating reference points for each of the label's text components. Civil 3D uses this label type as a parent style and creates two children styles for specific situation annotation: crest and sag.

The last label type is label sets. Alignments, profiles, and sections label sets annotate their properties within a drawing. A label set identifies label type styles that annotate the properties of an object. You must define the label styles for the label types before defining a label set.

The next installation of "CAD Clinic: Civil 3D" will review the use and definition of profile and section band styles.