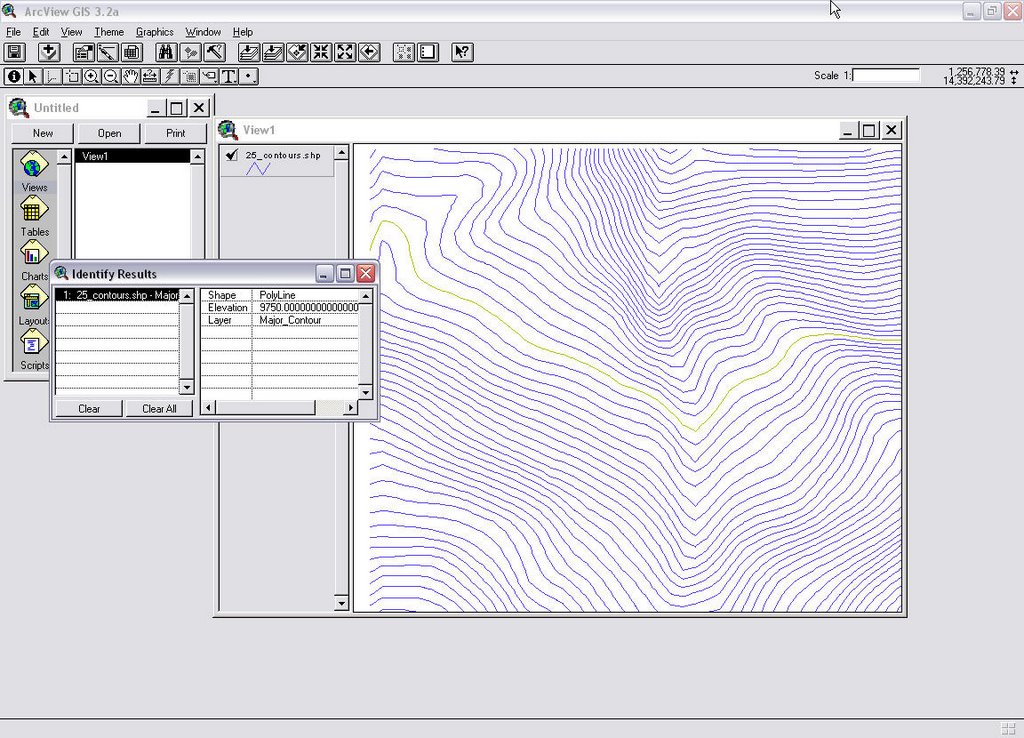
Do you have a contour line file that is in ESRI shp format and need to create a from it or need the contour lines to be at their correct elevation? You can import it and create civil surfaceObject Data from the lines’ attributes then perform an alter-properties query to set the lines at their correct elevations.
Start by using the map import command to import the shp file, located on the Map menu Tools > Import. Browse to the shp file and select it. For those not familiar with the shape format there needs to be at least 3 files that make up the ESRI shape format. (shp, shx, & dbf) When using the map import you only will see the file with the shp extension.

After you select the file and click OK the Import dialog box displays allowing you some options to set for the import, like the coordinate system transformation or doing a spatial filter and a few more. The only one we need to set is the “Data”. We will convert the shape file attributes into object data.

In the column on the lower half of the dialog click on under the column labeled Data. Then click on the ellipse icon (the 3 dots). This will display the Attribute Data dialog. In this dialog we select “Create object Data” and use the default Object Data table name which is the name of the shape file. Note: Map 3D 20008 versions prefixed with the word “Default” you can rename it if you desire.

You can click on the “Select Fields..” button and see what attributes will be converted and what Map 3D will name the Object Data (OD) fields. This is a good step to ensure there is a field that contains the elevation and it gets converted to the OD. After you view the fields/attributes select OK and OK in the Attribute Data dialog. Select OK in the Import Dialog and wait for the import to happen, the command line will let you know that X number of objects imported. Do a zoom extends and you should see the contour lines.
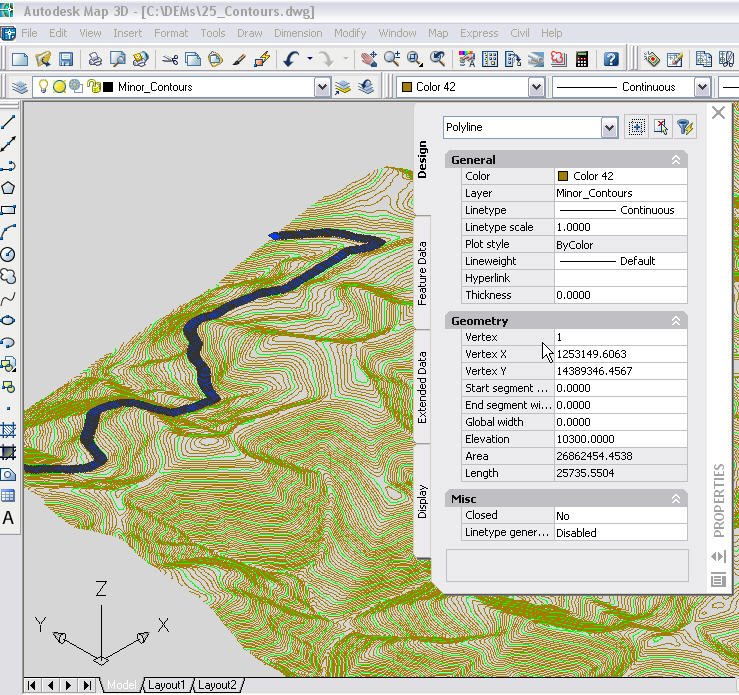
With the property palette open select a contour line and check that there is an OD table attached to the line and notice that the elevation is listed under the OD table and that the elevation for the Geometry is at “0”.

To get the OD Elevation value to the Geometry we need to perform an alter-property query on the drawing. Start by saving the drawing and close it, then open a new blank drawing or the project you need the contours in.
We start this by attaching the contour drawing that we just saved and closed, in the Map task pane on the map explorer tab right click the Drawing folder and select “Attach”.

Browse to the drawing and highlight it by selecting the name then click the “Add” button then click OK. The drawing should now be listed under the Drawings folder in the Map Explorer.
Now we need to get started on the query. On the Map Explorer, right quick on “Current Query” under the Query Library and select “Define”.

In the Define Query Dialog we need to click “Location” for the query type then select in the Location Condition dialog then click OK. Next we click on the “All”“Alter Properties” button in the option section of the dialog box.

In the “Set Property Altercations” dialog Click on the radio button next to Elevation in the Select Property section.

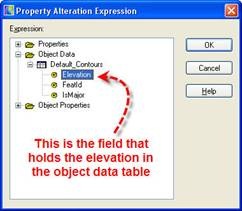
Now click on the Expression button to open up the Property Altercation Expression dialog. Expand the tree to get to the Object data field that contains the elevation. Highlight it by clicking on it and then click OK.

Back in the Set Property Altercations” dialog click on the “Add” button.

At this point we can click OK and return to the Define Query dialog select “Draw” for the query mode and execute the query.
HOWEVER! I want to go one step further with my query and set the major contours on a separate layer named Major and the minor contours on a layer named Minors. I can do this because my OD has one field in my sample named IsMajor. (see above screen shot) The values are 1 & 0, 1 for a major contour, 0 for minor. I am going to alter the layer property for the contours line by setting up a range table and use that for to place the contours on the correct layer. To do this while still in the “Set Property Altercations” I select the radio button next to the ‘Layer” property..

Then click on the “Range” button to start creating a range table.

In the Define Range Table dialog click new and give the range table a name then click OK. The next step is setting the conditions to use for the ranges. This takes knowing what the current OD values are and what you want to return the values as. In my case the values are 1 or 0, and I want them to return either “Major” or “Minor”. For my example it would be like so: In the Condition section, the operator is the equal sign (=) the “Expression Value” I type in 1 then in “Return Value” I type in Major. Then click the Add button.

Next I set the condition for the minor the same way, operator is the equal sign, for the “Expression Value” I type in 0, and for the “Return Value” I type in Minor, click the Add button again.


Once we set both conditions we can click OK. Now we need to set the rest of the alter property parameters. Back in the “Set Property Altercations” dialog, we click on the expression button and select the IsMajor field from the OD table.

After we OK the Property Altercation Expression and return to the “Set Property Altercations” dialog we select the range table we created from the drop down list and click Add.

We should now have two conditions or statements listed in the dialog.

We can now click OK and return to the Define Query dialog, make sure the query mode is set to Draw, and execute the query.
If everything worked right now we can open up the Layer Property Manager and set the color, line type or lineweight to the “new” layers to display the contour lines.

So with a little practice and trial and error we can take a simple 2d shape file and import then query it to make a good 3D drawing with proper elevations and display capabilities.
viewmore


 If you want to keep the source polylines then select No, otherwise choose Yes. Now you will want to change the style of the newly created
  Provide a name for the style, I choose
  Press enter to get out of the command. When you get out of the command you should notice that the style was not applied to the
  To get them to show the correct style, select the
  Now when you will have the surface contours will be hidden by the