Hiển thị các bài đăng có nhãn MAP 3D. Hiển thị tất cả bài đăng

Thứ Tư, 20 tháng 8, 2008

Contours from a DEM file to a SHP file with MAP 3D

Do you need to create a ESRI shp file for contours lines from a DEM file? You can with Map 3D by using the civil tools.

This post will be a quick walk-thru on doing it with some screen shots to help you. To start bring in the DEM as a surface.
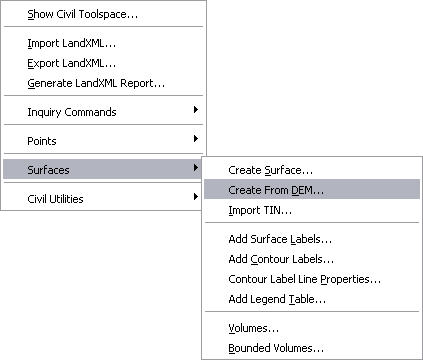
From the pull-down menu under “Civil-Surface-Create From DEM”
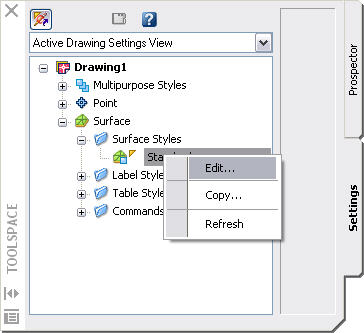
Browse to where the DEM file is located and select it. In a matter of seconds a new surface is created in MAP. Zoom extends and all you may see is a yellow rectangle. The reason you do not see anything is you may not have the styles for the surfaces set to display the objects(contours). The default display for civil surfaces in MAP is to show the border only for 2D display and triangles for 3D display. Open up the Civil Toolspace and click on the “Settings” tab. Expand the surface tree to show the Surface Style Standard. Right click on the standard style and click on edit.

The Style editor dialog will open, for that surface style. The first thing we need to tell MAP 3D is the contour intervals we want it to display. Click on the Contour tab at the top then expand the tree under Contour Intervals.
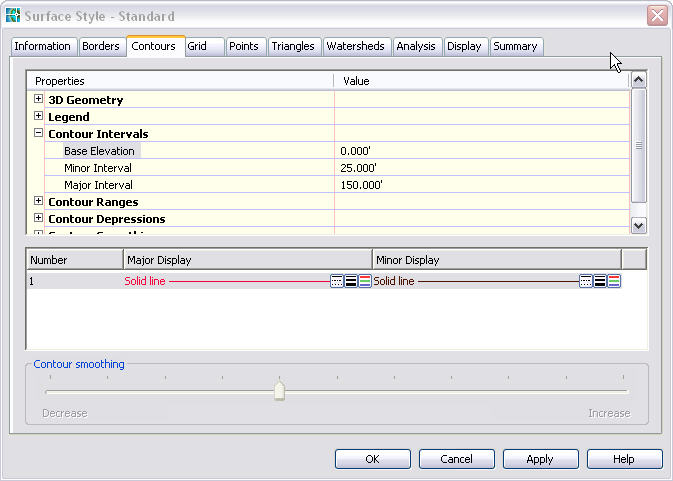

Set the Minor Interval to 25.00′ and the Major Interval to 150.00′. Keep the Base Elevation at 0.00′.
Next click on the Display tab so MAP 3D knows will know how we want them displayed.
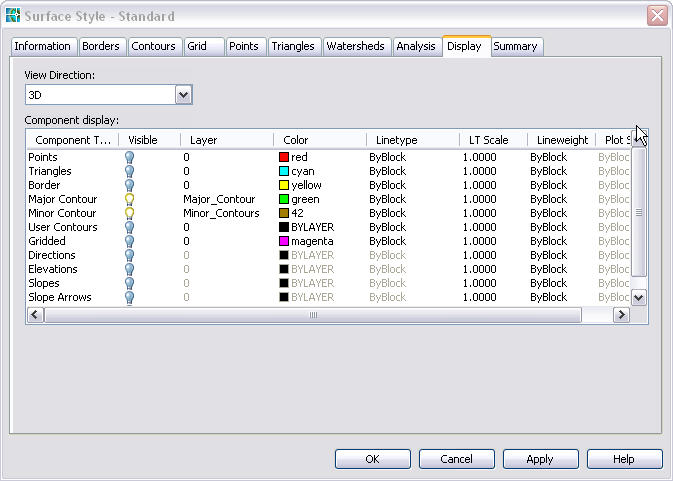

In the View Direction select 3D. Set the Triangles as invisible and Major Contours & Minor Contours as Visible by clicking on the light bulb icon. Next put the contours on their own layers by clicking under the layer for each and select a layer or create a new layer for each. Next you can check that the same settings are there under the View Direction for 2D by switching the 3D to 2D in the View Direction list box. Click apply and OK.

Map takes a few minutes to create and display the contour lines. They should be at the intervals you set and displayed by the color specified in the style editor not by the layer color. Now that you have the contours displayed you may notice they are not polylines but a single object. A Civil object at that, so we need to convert them into polylines to export to a shp file.

To convert them the first thing I like to do is change my view of them to a 3D view. Using the standard AutoCAD view menu switch to a 3D view (SW Isometric). After MAP rescans the surface you should see that the contours are at the correct elevations. This is a good tip to verify that the DEM was converted to a surface and displays the contours as you wanted. Then next step is to Export the surface to a AutoCAD dwg.
Under the Civil menu, select Civil Utilities>Export to AutoCAD>2004 format.


Save the exported dwg to the folder of your choice. After the export is complete open the dwg that you just created. It should be in the same 3D view as the surface when you exported it, again this is a tip to check and see that you have what you need for the shp file. There is no need to change the view in the new dwg. If you select a contour line, you will notice it is a polyline on the layer you set in the style editor and at the correct elevation.
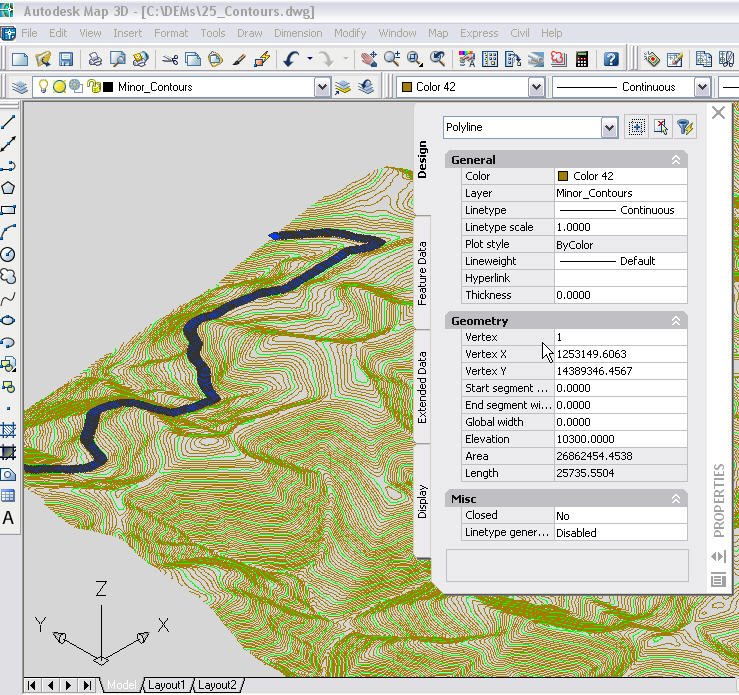

Now you have the correct objects to Export to a ESRI shp file. When you export it you can export the layer and elevations from the properties to include those in the shp file data.
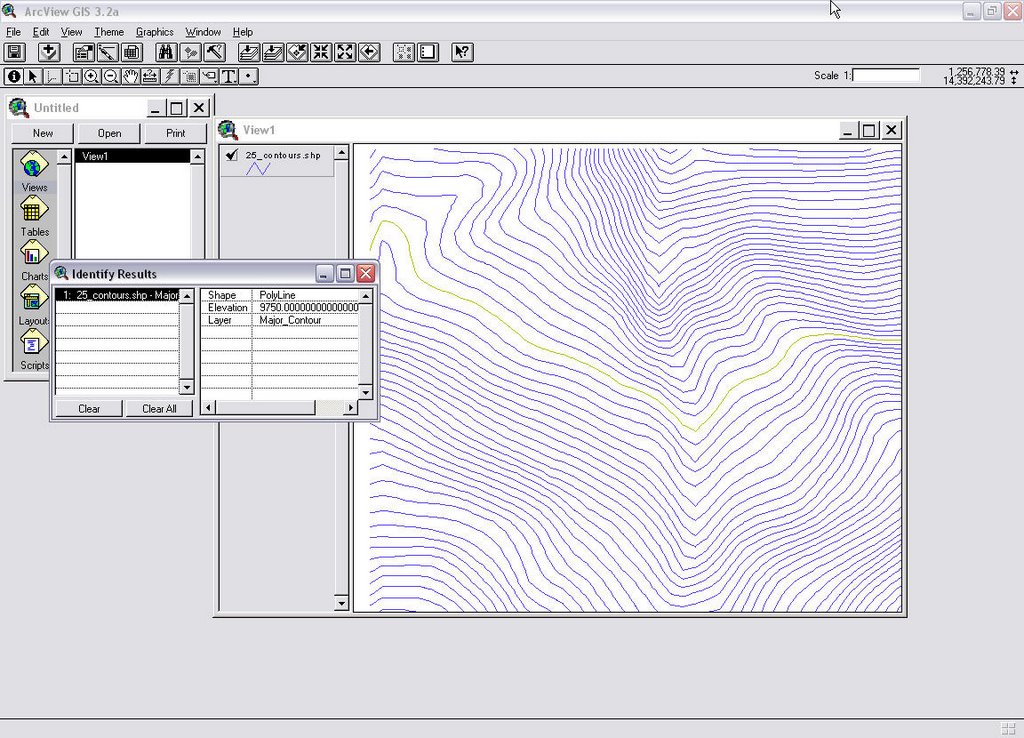

As you can see the contours lines with the elevations and layers are there in a ESRI table so anyone can now use the DEM file as contours in their GIS system.

Note this example was done using Map 3D 2006, the civil tools in Map 3D 2007 are different but I ‘ll try to post the how-do with R2007 in a few weeks.

An another item to be aware of, when you set the value for the contour intervals keep in mind the smaller the intervals the more there are and the bigger the file becomes then the longer it takes to rescan and redraw the surface

viewmore

Create a 3D Surface from a SHP File. (with survey extension)

Do you have the need to create a surface from a ESRI contour file, and that shape file is just 2D with the elevation as an attribute? The new released Survey Extension For Map3D will do it. It is as easy as 1, 2, 3.

Step 1. Use the data connect to connect to the shape file.

Connect_Shape

Note: all you need is to connect to it there is no need to add it to the map.

Step 2. Use the “Mapcreatesurface” command to open the Create Surface dialog.

Create_Icon

The Create surface tool is on the Input and Inquiry toolbar. if not just type the command at the command line.

Select_Connection

In the Create Surface Dialog, select “Connection” for the source and select the shp connection you made in the data connect.

Set_Z

Step 3. Provide a name and location for the Raster TIFF that will be created. Then select the field that contains the Elevation value in the attribute table.

Now press the OK button.

Now the results after setting a style to the surface feature layer and placing the original contours above it in the draw order.

Finished

OK if you count all the mouse clicks it may be more than 3 steps but, its quicker than firing up ArcInfo and using the tools to create the surface there then connect to it.

To those that may want to question the accurately of this compared to ESRI software, well I took the same shp file in ArcMAP created a TIN from it and converted that into a Raster. I then added that to this dwg and compared them in both 2D and 3D views. To me I didn’t see any difference between the two

viewmore

Label Those Lot Lines

Do you ever have the need to label lot lines in Map3D? Civil3D users have the parcel labels but with just Map3D it was always the old text command. Try using the map annotation block features instead. Here’s how you can create a annotation template that makes it a little easier. First the lot or parcel lines need to be lines or single element plines. So if you need to use the drawing cleanup tool first to break those polygons or closed plines into single element plines.
We start with creating an annotation template then use the property value “Length” for the value for our length tag. But we need to add a few extras to make it look right. First thing we don’t want all the labels to be 8 decimal places long, two is the standard most places, and second we need to add the FT (single quote) mark at the end.

length_tag

So to accomplish this the value should look like this
(STRCAT (RTOS .LENGTH 2 2) “‘ ” )
The RTOS converts the real (Length) value to a string value with the first 2 being the units type as Decimal and the second 2 as the precision. The STRCAT and the “‘ ” (double quote, single quote, double quote) then takes that length value and adds the single quote mark at the end. If you work in Meters you can replace the single quote with Meters, just make sure you keep it inside the double quotes. For the text options use your text style you need and for the height use the value that will meets your standards. Keep the rotation at 0 but set the justification at Middle Center. Use you own standards on the object properties for layer,, color and lineweight.
When you click OK and are asked for” Specify middle-center of text: ” go with 0, “your text height” this places the tag at it’s proper location with the justification at middle center.
Now for the bearings part of the annotation. Start a new annotation tag and for the value we use the angle property of the line but convert it to a string.

Bearing_tag

We do this because the angle property returns the angle in Radians not in degrees. So the value will be (ANGTOS .ANGLE 4 3).
The ANGTOS converts the radian value to a string and the 4 tells it what angle type to use in this case Surveyors and the 3 is the precision, taking it all the way down to seconds. Set the text options the same as for the length tag and the object options to your standards. This time when you are asked “Specify middle-center of text:” use 0, - “your text height”, to place it below the length tag.
Save your template and use the annotation tools in Map3D to label your lot lines. When you insert the annotation blocks is when you need to set the rotation value so use the expression .ANGLE to set it. Doing it here makes for cleaner labels and keeps the two lines aligned.

Rotation

Now for a couple of disclaimers: The annotation angle will be in the direction that the line was created. Most surveys start at the POB and go around in one continuous path. The labels need to follow that rule, that’s the way I was taught years ago and that’s the way I taught for years. However if your drawing is from a source that doesn’t follow that rule or you used the drawing cleanup tools the line may not be drawn in the proper order and will need to be adjusted. Another thing is the text may be upside down or on some of them the length is on the inside with the bearing on the outside while others are vise-versa. By setting grips enable for blocks and using the two tags instead of a multiline attribute tag allows you to move and adjust the placement as needed.

Labels

The Finished project.


viewmore

Contours from Shape Files with Elevations

Do you have a contour line file that is in ESRI shp format and need to create a from it or need the contour lines to be at their correct elevation? You can import it and create civil surfaceObject Data from the lines’ attributes then perform an alter-properties query to set the lines at their correct elevations.

Start by using the map import command to import the shp file, located on the Map menu Tools > Import. Browse to the shp file and select it. For those not familiar with the shape format there needs to be at least 3 files that make up the ESRI shape format. (shp, shx, & dbf) When using the map import you only will see the file with the shp extension.

clip_image002

After you select the file and click OK the Import dialog box displays allowing you some options to set for the import, like the coordinate system transformation or doing a spatial filter and a few more. The only one we need to set is the “Data”. We will convert the shape file attributes into object data.

clip_image004

In the column on the lower half of the dialog click on under the column labeled Data. Then click on the ellipse icon (the 3 dots). This will display the Attribute Data dialog. In this dialog we select “Create object Data” and use the default Object Data table name which is the name of the shape file. Note: Map 3D 20008 versions prefixed with the word “Default” you can rename it if you desire.

clip_image006

You can click on the “Select Fields..” button and see what attributes will be converted and what Map 3D will name the Object Data (OD) fields. This is a good step to ensure there is a field that contains the elevation and it gets converted to the OD. After you view the fields/attributes select OK and OK in the Attribute Data dialog. Select OK in the Import Dialog and wait for the import to happen, the command line will let you know that X number of objects imported. Do a zoom extends and you should see the contour lines.

With the property palette open select a contour line and check that there is an OD table attached to the line and notice that the elevation is listed under the OD table and that the elevation for the Geometry is at “0”.

clip_image008

To get the OD Elevation value to the Geometry we need to perform an alter-property query on the drawing. Start by saving the drawing and close it, then open a new blank drawing or the project you need the contours in.

We start this by attaching the contour drawing that we just saved and closed, in the Map task pane on the map explorer tab right click the Drawing folder and select “Attach”.

clip_image010

Browse to the drawing and highlight it by selecting the name then click the “Add” button then click OK. The drawing should now be listed under the Drawings folder in the Map Explorer.

Now we need to get started on the query. On the Map Explorer, right quick on “Current Query” under the Query Library and select “Define”.

clip_image012

In the Define Query Dialog we need to click “Location” for the query type then select in the Location Condition dialog then click OK. Next we click on the “All”“Alter Properties” button in the option section of the dialog box.

clip_image014

In the “Set Property Altercations” dialog Click on the radio button next to Elevation in the Select Property section.

clip_image016

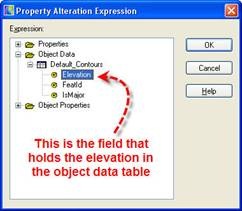
Now click on the Expression button to open up the Property Altercation Expression dialog. Expand the tree to get to the Object data field that contains the elevation. Highlight it by clicking on it and then click OK.

clip_image018

Back in the Set Property Altercations” dialog click on the “Add” button.

clip_image020

At this point we can click OK and return to the Define Query dialog select “Draw” for the query mode and execute the query.

HOWEVER! I want to go one step further with my query and set the major contours on a separate layer named Major and the minor contours on a layer named Minors. I can do this because my OD has one field in my sample named IsMajor. (see above screen shot) The values are 1 & 0, 1 for a major contour, 0 for minor. I am going to alter the layer property for the contours line by setting up a range table and use that for to place the contours on the correct layer. To do this while still in the “Set Property Altercations” I select the radio button next to the ‘Layer” property..

clip_image022

Then click on the “Range” button to start creating a range table.

clip_image024

In the Define Range Table dialog click new and give the range table a name then click OK. The next step is setting the conditions to use for the ranges. This takes knowing what the current OD values are and what you want to return the values as. In my case the values are 1 or 0, and I want them to return either “Major” or “Minor”. For my example it would be like so: In the Condition section, the operator is the equal sign (=) the “Expression Value” I type in 1 then in “Return Value” I type in Major. Then click the Add button.

Cond1

Next I set the condition for the minor the same way, operator is the equal sign, for the “Expression Value” I type in 0, and for the “Return Value” I type in Minor, click the Add button again.

Cond2

clip_image026

Once we set both conditions we can click OK. Now we need to set the rest of the alter property parameters. Back in the “Set Property Altercations” dialog, we click on the expression button and select the IsMajor field from the OD table.

clip_image028

After we OK the Property Altercation Expression and return to the “Set Property Altercations” dialog we select the range table we created from the drop down list and click Add.

clip_image030

We should now have two conditions or statements listed in the dialog.

clip_image032

We can now click OK and return to the Define Query dialog, make sure the query mode is set to Draw, and execute the query.

If everything worked right now we can open up the Layer Property Manager and set the color, line type or lineweight to the “new” layers to display the contour lines.

clip_image034

So with a little practice and trial and error we can take a simple 2d shape file and import then query it to make a good 3D drawing with proper elevations and display capabilities.


viewmore