Thứ Bảy, 23 tháng 8, 2008

Advanced Road Design CORRIDOR-EZY

Step 1: Open original drawing with about 26 Alignments (see image below).
Step 2: Press one button. 45 second later drawing contains items software recognizes as "ROADS" and creates proposed profiles for them (see image below).

Step 3: Press a second button. 1 minute 5 seconds later drawing contains all curb return alignments and proposed profiles for them as well (see image below).

Step 4: Press a third button. 2 minutes and 5 seconds later a surface exists of the entire road system in a development (see image below).

4 minutes total!

Now, I do not wish to mis-lead anyone. I have not yet addressed Knuckles or Cul-De-Sacs, which this software can address along with Roundabouts. I would want to check all proposed profiles, change widths of certain collector streets, etc. But, for 4 minutes worth of work to do 33 intersections along 26 streets this is ama-za-zing stuff.

To qualify this, remember that I gave a Knuckle and Cul-De-Sacs class at Autodesk University this past November.

With some instruction we can create true Civil 3D corridors in a fraction of the time it would take with Civil 3D alone. Using Civil 3D by itself, in my opinion, a capable person could create an intersection for scratch in about roughly 1 hour (that means about 33 hours for the example above). At just about any price this product should pay for itself in no time at all.

And imagine what this will do for those involved with preliminary design and visualization, I can not think of a better tool to do that.

Oh, and I almost forgot the most impressive thing of all. Profiles of crossing streets are linked by the software. If I raise or lower a major road... ALL CROSSING ROAD PROFILES ARE ADJUSTED TO MATCH AUTOMATICALLY! Yes, all crossing road profiles. That includes the curb return profiles. We do not have to go back and adjust them manually. How awesome is that!

You may be asking, when can we expect to see this product? I understand that it should be available just about when Civil 3D 2008 is released, near April 16, 2007. If this all sound somewhat familiar that is because this is the next incarnation of Advanced Road Design INTERSECTION which has been out for awhile.

Thank you CADApps!


viewmore

ARD/EZY + Corridors

ARD/EZY + Corridors - (how to create the corridor)

(a follow on from this post)
This has become topical recently as there have been questions on exporting ARD models to Trimble and Leica instruments for setout. (LandXML is an option but its cool to take the corridor)

Creating the corridor from ARD is a one click operation - there are 2 minor setups to do first.

We’re assuming the network is all modeled up in ARD so we’re just going to look at the steps to generate a full corridor object.

[More:]


Setup part 1 - the Super Subassembly…

This is a dodgy, cheezy name for a very useful tool.

  • Go to the Catalug Library (General>Catalog..), select the CadApps Catalog, select the ‘CADApps Subassemblies’ and drag the ‘ARD Super Subassembly’ into the tool palletes.

(This step only has to be done once)


Setup part 2 - the EZY Assembly…

  • Create a new Assembly, call it ‘CORRIDOR-EZY’ - (the name is crtical).
  • Add the ARD Super Subassembly left and right as in the diagram

You do not need to worry about making specific assemblies for specific cross section types in the job - this one will stretch and adapt as necessary while adding Kerb & Gutters etc.
This is possibly why they gave it the classy ’super subassembly’ handle. This Assembly will have to be present in every file you want to auto create corridors from. In 2009, its nice and easy to drag these assemblies to the pallets - I haven’t heard when ARD will be available for 2009 but will keep a look out.


Create the Corridor..

This part is simple,

  • Click Roads > Civil 3D Outputs > Auto Create Corridor.

The Profiles etc are created automatically and the corridor model is formed. If all you are after is a method of getting the Road Model to upload for setout, then you are ready to rock.

You will be prompted for default styles for Civil 3D objects, (Profile Styles, Band Sets etc)

Transfer Menu

Transfer Menu - Click on a Tab

Convert

LDD

Key File

Allows the user to select a Key Description file created in
Land Desktop to be imported into Civil 3D. For future convenience
this process should be carried out on a new drawing after which
the imported file information can be saved to a drawing template.

Convert

Civil Cad Correlation

Allows the users to select a CivilCad Correlation file (OUT) to be
imported into Civil 3D Key Description file with associated
Point Styles. Shown below is asample of the required format for
the file.

CIVILCAD 5       Job JOB1091   Date  11/03/04 12:15:02
File C:\CCAD572\TEMP\JOB1091.OUT
Job details  11/03/04            BLACK WEIR PARK     DETAIL SURVEY       
Code       Description               Layer     Symbol  1  2 3 4 5 6 7 8 9 10
. . . . . . . . . .
BB BOTTOM OF BANK BANK none 3 2 P S C B Y Y Y
BDY BOUNDARY LINES BDY $CIR1 1 0 P S C Y Y Y
BIN PERM BIN BASE $CIR2 15 0 P S C Y Y Y
BLD BUILDING BUILD none 2 0 P S C B Y Y
BM BENCH MARK SURMK $CIR1 14 0 P S C Y Y Y
BU BUILDING BUILD none 2 0 P S C Y Y Y
BUS BUS SHELTER FEAT none 12 0 P S C Y Y Y
CG CHANGE GRADE LEVEL none 15 0 P S C B Y Y Y Y

Switch

Civil Cad Coding

Many existing data sets have the string number precede
the description code to suit requirements of different software
packages. Stringer requires the numeric String number to be after
the code. This function will swap the code with the string number.
Note that it is only applicable with alpha codes as Stringer will
string any numeric code with a minimum of 4 digits by default
or one more digit than the number referenced in the Numeric.dat

file Example 01EB becomes EB01 or, for numeric coding, 01102
becomes 10201

Import

CivilCad

AS5

Allows the user to select a Civilcad ASCII 5 file (AS5) to be imported
into Civil 3D,creating a point group called CIVILCAD_ and a surface,
also called CIVILCAD_. The point group is created with all points,
and then excludes the points flagged in the CivilCad file as
non-Contourable. This point group is associated with the new surface,
which also has the breaklines added.The result is a surface that
reflects the build information in the as5 file.

Import

Geocomp

File

Allows the user to import a GEOCOMP file (PTS and STR) into
Civil 3D,bringing in points and strings

Export Breaklines

to Fault

File

Creates a fault file (*.flt) of the breaklines that are in the
selected Surface.If only one surface exists then the surface
selection is automatic

#Stringer Fault file from Surface SURVEY
S1110.895320 1830.728095 101.064928 BB1
1110.718403 1826.122919 101.076466
1110.541485 1821.517742 101.088004
1110.364568 1816.912565 101.099543
1107.200061 1816.301136 101.067110
S1122.320525 1833.967723 98.623125 BB11
1126.068717 1829.919841 98.794631

Replace

AEC

Points

Replaces all of the Points in the Civil 3D drawing with either
an attributed block called POINT or with plain TEXT. The point
block has 3 attributes:

DESC for the Full Description, taken from the Key Description Table
ELEV for the elevation
POINT for the point number

Each of the point markers assigned from the Point Styles are also inserted,

with the programme attempting to emulate the scale and rotation of the symbols. The layer for the symbol is also used.

Replace

Carlson

Points

Replaces all Carlson points with Civil3D points

Export

Block

Exports all Blocks in the current drawing to individual drawing files. It is effectively an automated wblock.

Import/

Export

Layers

Exports all of the layers in the current drawing to a CSV file,
which can then be imported into a new drawing, or, more likely, a drawing file from a client that does not use your layer structure.

StringerConnect


Stringer Connect is designed to allow the conversion of raw
field information to a format known as the RW5 format or to the FBK
format required for the Survey Database of Civil3D and Land Desktop.
Once converted, the programme then offers the survey information in
the editor for amendments and additions of the survey data. Once the
field file is amended, and the alterations saved to the RW5 file, we can
reduce the information to coordinates or save to the Autodesk Field Book file (FBK).

For reduction purposes, you can nominate a control file in CSV
(Point number, East, North, Elevation, Code) or RW5 format.
The coordinates from the control file override the coordinates
in the field file if the same point exists in both. Once the observations are reduced,
you can use the transformation capability of Reducer to translate, rotate,
and even scale the field information based on a datum line nominated.

Key Benefits

Converts most instrument formats to the standard rw5 and FBK format
Recognises the FBK parameters for linework creation
Allows for Resection in the raw data
Very good reports within the coordinate reduction for miscloses, etc

Pricing - free

Please send an email requesting the programme to info@stringersurvey.com

A Taste of Some of the commands in StringerConnect

The file selection page of StringerConnect, showing some of the file types that can be interpreted.
The raw data editing page. After making any amendments necessary, you can save the file as a FBK file or reduce to coordi
nates.


viewmore

String Edit Menu

String Edit Menu - Click on a Tab

Add 3D Polylines to Surface

Allows the user to select 3D polylines to be added to the current surface as breaklines.

Join 3D Poly

Allows the user to join two selected lines/polylines to make one 3D polyline.
If the two objects don't join at the ends this command will create the necessary link segment.

3D Poly from 2D Poly

Allows the user to create a 3D polyline from a 2D Polyline passing through points on the surface. The created 3D polyline will be created on a layer with the same name as the 2D polyline with the suffix _3D. For example if the 2D polyline was on a layer RD_EB then the 3D polyline will be created on RD_EB_3D.

Remove Poly Segment

Select a 3D polyline segment and the segment is erased leaving the remaining components of the polyline in the drawing. If the polyline was not closed then two new polylines will be created.

Offset Polyline

Allows the user to select an existing polyline and then select a template to be drawn on that polyline. If a 3D polyline is selected then the software will offset with 3D polylines and add them to the surface. If a 2D polyline is selected then the software will offset 2D polylines only. If no template is selected (selecting Cancel at the template selection dialog box) then the user can specify the offset required. When a 3D polyline is selected, the user will be prompted for a horizontal and vertical offset.

Embed New Code

Used for when a new string code needs to be inserted into an existing string code, such as replacing a section of kerbing with a crossover. The programme will add the new code to the selected points (automatically finding a unique string number for the code). It will then find a new unique string number for the continuing string.

Here we have embedded XOL (Cross over Left) into the string KSLL143. Notice that the second (and subsequent) points have had the code KSLL143 changed to KSLL07, which was the next unique string number for code KSLL.

Increment String Numbers

Allows the user to increment the string number of a selection of stringable points by a specified amount. You may select the points individually or by group (remembering that _all points is a group)

Auto Increment ..

This command allows the user to automatically increment string numbers for points of common string codes in point number order.

Using EB1.. again in the above example would result in Stringer creating a new, unique, string number that would be applied to all subsequent points with code EB1

Reorder Point Numbers based on Selected Polyline

Allows you to select a polyline which has a civil3d point at each vertex and sort the point numbers in ascending order based on the selected polyline. This means you can manually draw a polyline then select to reorder the points based on that polyline.

Inc Codes on Polyline

Allows you to select a polyline which has Civil3d points at each vertex with the intention of changing the raw description of each of those points based on the new description you enter. This is especially useful for jobs that have been manually strung and you would like the points to reflect the string codes.

Switch Point Numbers

Simply allows the user to select 2 points and switch the point numbers between those 2 points. Intended for when a couple of points are surveyed out of sequence.

Reorder by Next Distance

Reorders the points with the same code based on the shortest distance to the next point. After selecting the first point (which also sets the code to scan for) the programme automatically reorders the point numbers based on the next nearest point.

Reorder Point Numbers by Selection

Allows the user to select a range of points in the order that they would like the point numbers to increase. It uses the point numbers of the points selected and simply reorders them so that they increase in the same order as the order they were selected in. Intended for when a series of points on a string line have been surveyed out of sequence.

Reorder Automatic

Reorder Points either by angle or linear distance. Angle option orders in an Anti Clockwise direction based on a start point, centre point, and code. After selecting the point which is the start point for the ordering, you select the centre point about which the ordering is to be calculated. The simplest case for this is a roundabout where the point numbers are not in the correct order. This routine will renumber the points so the string line is correct. If you do not select a centre point then linear sorting by distance is used whereby points are reordered in ascending distance from the start point.

Thứ Sáu, 22 tháng 8, 2008

Stringer - Survey Solutions for Civil3d

The Hierarchical Structure of Layers for Point Styles

If you wish to use layers to control visibility of labels, then you need to turn off the Layer Override in the Key Description Table and allow the Point Style layers to take effect. The downside of this is that when you list a point it will always return that it is on layer 0, even though turning off the appropriate point style layer will effect the point. You will see from my attached Point Style settings that the Power Pole is put onto 2 layers, but the label information is not normally visible.
However, when I first import the survey information I want to see EVERYTHING. To accomplish this I have a point group called checksurvey which includes all points and has an override label style that displays all data. This group is at the top of my group list in my template. See picture number 2.

When I want the points to look how I want when I plot, I go into Point Group properties and simply move this point group to the bottom of the list of pointgroups.


When you get used to it, it is very efficient. As I said, you can accomplish this with disabling the layers in the Key Description Table, but I like to see the object layer when I list it, so that option was out.

Point Symbol Scaling in Civil3D

To get the point symbols to automatically rescale in a viewport, you must have the Key Description and Point Style settings working together.

The Key Description Setting firstly: Notice the Use Drawing Scale is turned off here.

Now the Point Style for SMH:

Thats it. Get these 2 right and your symbols will automatically scale in your viewport.

Labels with different Precisions

If you want to display point elevations to different levels of precision, you need to create separate label styles. The easiest way to create a new label style is to copy one that is very similar. Here we will copy the label style that only shows the elevation (and displays it to 2 decimal places) and create a new style that will display to 3 decimal places.

Firstly, we copy the style RL ONLY and rename it to RL000
Then we change the contents...
So that our precision is now 3 decimal places.
Then we go back to the Key Description Table and assign it

Thứ Năm, 21 tháng 8, 2008

Using AECPolygon to Hide Surface Contours


I've been looking on the many hidden commands that are included in the program, but are undocumented. One of them is AECPolygon. One of the uses I thought of would be to hide surface contours with out having to select each polyline, like you would have to do with the boundary hide command. Learn more after the annoying jump...

You can use existing polylines or create the AECPOLYGON the same way you would draw a regular polyline. In this example I will create the AECPOLYGON's from existing polylines. To start type AECPOLYGON into the command line. Select the Convert option and select the PLines option. Select the polygons that you want converted to mask the surface.
If you want to keep the source polylines then select No, otherwise choose Yes. Now you will want to change the style of the newly created AECPOLYGON to do this press S for Style. A style manager will pop up onto the screen. Right click on AEC Polygon Styles and Choose New.
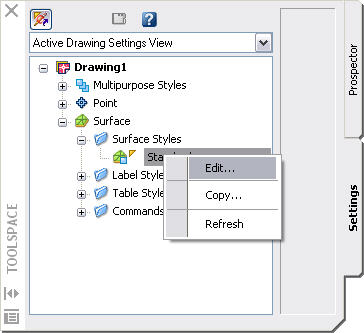
Provide a name for the style, I choose HideContour. Go to the other tab and select Use Background Mask and select OK at the bottom of the screen.

Press enter to get out of the command. When you get out of the command you should notice that the style was not applied to the AECPOLYGON's.

To get them to show the correct style, select the AECPOLYGONs and go to properties and change it to show the style you created.
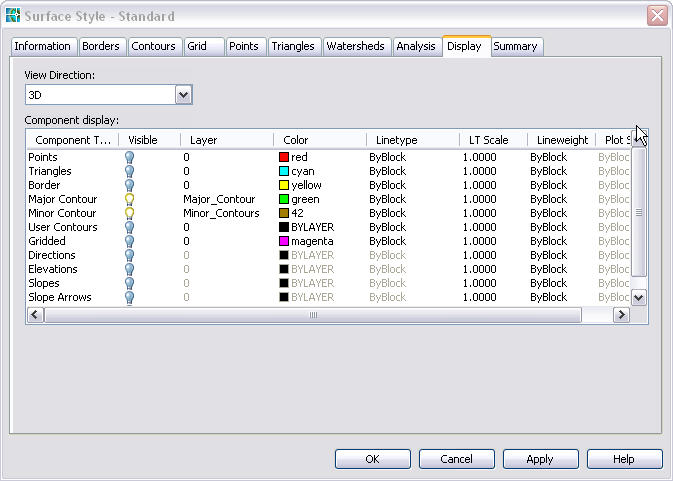
Now when you will have the surface contours will be hidden by the AECPOLYGON.


Unlike the Surface Boundary Hide, you have to worry about draworder and you can't print them from model space without changing the color of the mask (if you do it will come out as a black box). As long as you want the surface printed first it should be pretty easy to manage; send any surfaces to the back in which you don't want the contours being masked, then send the AECPOLYGONs to the back and then the Surface to be masked to the background.

This may also seem like the same as the wipeout command but there are somethings I like which are better, for instance you can add and remove vertexes throught the right click menu and there is an extra grip between vertexes that allows you to drag the edges and they stay parallel to the original line. Give it a try you may like it or not.

Disclaimer: I haven't actually used this in production, but will probably do so in the future.

viewmore

Thứ Tư, 20 tháng 8, 2008

Contours from a DEM file to a SHP file with MAP 3D

Do you need to create a ESRI shp file for contours lines from a DEM file? You can with Map 3D by using the civil tools.

This post will be a quick walk-thru on doing it with some screen shots to help you. To start bring in the DEM as a surface.
From the pull-down menu under “Civil-Surface-Create From DEM”

Browse to where the DEM file is located and select it. In a matter of seconds a new surface is created in MAP. Zoom extends and all you may see is a yellow rectangle. The reason you do not see anything is you may not have the styles for the surfaces set to display the objects(contours). The default display for civil surfaces in MAP is to show the border only for 2D display and triangles for 3D display. Open up the Civil Toolspace and click on the “Settings” tab. Expand the surface tree to show the Surface Style Standard. Right click on the standard style and click on edit.


The Style editor dialog will open, for that surface style. The first thing we need to tell MAP 3D is the contour intervals we want it to display. Click on the Contour tab at the top then expand the tree under Contour Intervals.


Set the Minor Interval to 25.00′ and the Major Interval to 150.00′. Keep the Base Elevation at 0.00′.
Next click on the Display tab so MAP 3D knows will know how we want them displayed.


In the View Direction select 3D. Set the Triangles as invisible and Major Contours & Minor Contours as Visible by clicking on the light bulb icon. Next put the contours on their own layers by clicking under the layer for each and select a layer or create a new layer for each. Next you can check that the same settings are there under the View Direction for 2D by switching the 3D to 2D in the View Direction list box. Click apply and OK.

Map takes a few minutes to create and display the contour lines. They should be at the intervals you set and displayed by the color specified in the style editor not by the layer color. Now that you have the contours displayed you may notice they are not polylines but a single object. A Civil object at that, so we need to convert them into polylines to export to a shp file.

To convert them the first thing I like to do is change my view of them to a 3D view. Using the standard AutoCAD view menu switch to a 3D view (SW Isometric). After MAP rescans the surface you should see that the contours are at the correct elevations. This is a good tip to verify that the DEM was converted to a surface and displays the contours as you wanted. Then next step is to Export the surface to a AutoCAD dwg.
Under the Civil menu, select Civil Utilities>Export to AutoCAD>2004 format.


Save the exported dwg to the folder of your choice. After the export is complete open the dwg that you just created. It should be in the same 3D view as the surface when you exported it, again this is a tip to check and see that you have what you need for the shp file. There is no need to change the view in the new dwg. If you select a contour line, you will notice it is a polyline on the layer you set in the style editor and at the correct elevation.


Now you have the correct objects to Export to a ESRI shp file. When you export it you can export the layer and elevations from the properties to include those in the shp file data.


As you can see the contours lines with the elevations and layers are there in a ESRI table so anyone can now use the DEM file as contours in their GIS system.

Note this example was done using Map 3D 2006, the civil tools in Map 3D 2007 are different but I ‘ll try to post the how-do with R2007 in a few weeks.

An another item to be aware of, when you set the value for the contour intervals keep in mind the smaller the intervals the more there are and the bigger the file becomes then the longer it takes to rescan and redraw the surface

viewmore

Points from a text file

One of the tasks a Map user has to do is bring in points from a text file or a database. With the civil 3D tools in Map R2005 & 2006 you could use the civil points tools to do this but it required the point file to be in a certain format and we end up having to work on getting it to work correctly a few times when we don’t use it all the time. But thanks to a reminder from a poster on the AutoDesk discussion groups for reminding me of an old forgotten AutoCAD command, the “Multiple” command. What this command does is repeats a command that you provide in the command line until you press the escape button.
The thing you need too do is make sure the text file contains nothing but the coordinates for the points, if you have attributes or a point number mixed in with the coordinates you need to delete them from the file. So your text file is something like this:

1705145.103,829479.6554,0
1708780.203,825996.5793,0
1709520.941,823934.5335,0
1710569.845,824786.8715,0
1710583.068,824685.7594,0
1709493.485,828888.0862,0
1709298.454,831331.2523,0

Now with the file open select all the points and use ctrl+C to copy the lines to the windows clipboard. Back in your drawing give the MULTIPLE command, then the POINT command then paste the text from the clipboard by using ctrl+v when it asks “Specify a point”. The points should be created based on the text file. You then have to press the escape key to end the MULTIPLE command.

Command: multiple
Enter command name to repeat: point
Current point modes: PDMODE=35 PDSIZE=0.0000
Specify a point: “ctrl&v to paste the text file here”.

A simple way to add points, keep in mind your point mode settings so you can see the points but this is a quick way to bring simple points into your map.

viewmore

Create a 3D Surface from a SHP File. (with survey extension)

Do you have the need to create a surface from a ESRI contour file, and that shape file is just 2D with the elevation as an attribute? The new released Survey Extension For Map3D will do it. It is as easy as 1, 2, 3.

Step 1. Use the data connect to connect to the shape file.

Connect_Shape

Note: all you need is to connect to it there is no need to add it to the map.

Step 2. Use the “Mapcreatesurface” command to open the Create Surface dialog.

Create_Icon

The Create surface tool is on the Input and Inquiry toolbar. if not just type the command at the command line.

Select_Connection

In the Create Surface Dialog, select “Connection” for the source and select the shp connection you made in the data connect.

Set_Z

Step 3. Provide a name and location for the Raster TIFF that will be created. Then select the field that contains the Elevation value in the attribute table.

Now press the OK button.

Now the results after setting a style to the surface feature layer and placing the original contours above it in the draw order.

Finished

OK if you count all the mouse clicks it may be more than 3 steps but, its quicker than firing up ArcInfo and using the tools to create the surface there then connect to it.

To those that may want to question the accurately of this compared to ESRI software, well I took the same shp file in ArcMAP created a TIN from it and converted that into a Raster. I then added that to this dwg and compared them in both 2D and 3D views. To me I didn’t see any difference between the two

viewmore