Thứ Sáu, 19 tháng 9, 2008

Ứng dụng Civil 3D hiệu quả vào đánh giá hiện trạng khu đất

Trong công tác thiết kế và thi công đồ án Quy Hoạch Chiều Cao ( QHCC ) có nhiều chi tiết chưa đựợc thực hiện tốt và có những mâu thuẫn nhất định. Đặt biệt là việc đánh giá hiện trạng khu đất để đưa ra phương án thiết kế QHCC, thiết kế những đoạn đường có độ dốc nhỏ, đoạn đường cong đứng, đường cong nằm đơn giản, đường cong nằm có siêu cao, chuyển tiếp, mở rộng…

Trên thực tế việc đánh giá hiện trạng khu đất dựa trên cao độ tự nhiên hoặc bằng cách xem xét trực tiếp tai khu đất, đánh giá theo phương pháp này chỉ phù hợp cho những vùng có diện tích nhỏ và địa hình tương đối bằng phẳng. Đối với khu đất có diện tích rộng, địa hình phức tạp thì việc đánh giá như trên còn mang tính chủ quan và thiếu chính xác, vì thế phương án thiết kế QHCC chưa tận dụng triệt để điều kiện tự nhiên để đưa ra phương án thiết kế QHCC tốt nhất và thuận lợi cho thiết kế kỹ thuật tuyến.

Thiết kế kỹ thuật tuyến (trong đó sử dụng chủ yếu là thiết kế cắt dọc và cắt ngang) và thiết kế QHCC ( sử dụng đường đông mức thiết kế ) đang được tiến hành với các tuyến đường đô thị. Nhiều đồ án hiện nay vẫn chưa thể hiện chính xác đường đồng mức thiết kế trong QHCC để phù hợp với mặt cắt dọc, mặt cắt ngang thiết kế kỹ thuật tuyến, nhất là tại những đoạn đường cong đứng, đừờng cong nằm, đường cong chuyển tiếp và tại các nút giao thông. Sở dĩ những đồ án có sai sót vì việc các đường đồng mức thiết kế ở những vị trí này khá phức tạp, mặt khác chưa có tài liệu hướng dẫn thiết kế chi tiết để giúp người thiết kế thực hiện công việc.

Yêu cầu của công tác QHCC không chỉ đánh giá đúng hiện trạng khu đất tại những khu vực thấp, cao, hướng nước chảy chung của khu đất mà còn phải đánh giá chi tiết tại những vị trí có tuyến đường băng qua hoặc tại các vị trí khác để bố trí mạng lưới hạ tầng kỹ thuật. Đánh giá đúng hiện trạng khu sẽ rất thuận lợi cho công tác thiết kế QHCC. Xây dựng tuyến đường không chỉ bằng phẳng, đủ độ nhám mà còn êm thuận thoát nước tốt và tạo mỹ quan đô thị. Tất cả những điều này đòi hỏi phải đánh giá thật đúng hiện trạng, thiết kế đẹp và thi công tốt.

Xuất phát từ thực tiễn trên, đề tài nghiên cứu đề xuất phương án đánh giá chi tiết hiện trạng khu đất, thiết kế kỹ thuật tuyến tại các nút giao thông và tuyến đường phức tạp đồng thời tính toán khối lượng đào đắp cho vùng thiết kế QHCC nhằm chính xác hóa, đồng bộ hóa giữa các khâu thiết kế QHCC và kết hợp với thiết kế kỹ thuật tuyến. Sau đó áp dụng công cụ tin học để giảm nhẹ công việc của nguời thiết kế.

1. Đánh giá hiện trạng khu đất

Trên thực tế, trong thiết kế quy hoạch san nền để mô tả được bề mặt hiện trạng người ta đã dựa vào cao độ hiện trạng và xem xét khu đất trực tiếp ngoài thực tế. Tuy nhiên để áp dụng cách này để đánh cho một vùng có diện tích lớn, hoặc địa hình phức tạp thì tính chính xác sẽ giảm đi rất nhiều vì góc nhìn sẽ hạn chế, không xác định chính xác ranh giới giữa các mặt đất có cùng cao độ với nhau. Để có được đánh giá chính xác tính chất hình học của bề mặt khu đất xây dựng trên bất kì diện tích nào thì bề mặt ấy phải được mô phỏng trực quan và được đánh dấu tại các điểm muốn xem xét kĩ hơn về dộ dốc, hướng nước chảy…

*Việc đánh giá hiện tại.

Xem xét thực tế sau đó dựa vào cao độ, khoanh vùng đồng mức để đánh giá hiện trạng

a)


b)

Hình 1 : a) Cao độ hiện trạng của khu đất

b) Khu đất ngoài thực tế
Phương pháp nội suy cao độ để xem xét chi tiết hơn tại những vị trí trên khu đất chiếm nhiều thời gian và mắc phải sai số. Mặc khác yêu cầu của công tác đánh giá hiện trạng vừa mang tính tổng quát để đưa ra phương pháp quy hoạch vùng hợp lý vừa chi tiết tại nhiều vị trí để bố trí mạng lưới và thiết kế chi tiết cho phù hợp.

Những thiếu sót của việc đánh giá hiện trạng mà ngừời thiết kế thường mắc phải .

Ranh giới giữa các khoảng đồng mức chưa thể hiện rõ và chưa xác định được chính xác hướng nước chảy tại một điểm nào đó trên bản đồ hiện trạng.

a)

b)

Hình 2 : Đường đồng mức hiện trạng khu đất

a) Tại một vị trí nhìn gần
b) Tại một vị trí nhìn xa

Việc khoanh vùng chính xác đồng mức và hướng nước chảy có ảnh hưởng rất lớn đến phương án thiết kế đồ án quy hoạch san nền. Thuận lợi nhất để chọn phương án thiết kế phù hợp với hiện trạng có sẵn.Để có được cách đánh giá toàn diện nhất đối với địa hình tự nhiên cần phải số hóa bình bồ và thể hiện bằng một bề mặt được mô phỏng như thực tế tại mọi vị trí trên khu đất.

Những cách thể hiện khác nhau để mô phỏng địa hình bằng bề mặt

- Bề mặt được thể hiện bằng màu sắc và có hướng dốc toàn vùng

a)

b)

Hình 3 : Hiện trạng khu đất được mô phỏng bằng phân mềm civil 3D

a) Từng khoảng đổng mức của khu đất được thể hiện bằng màu sắc

b) Thể hiện hướng dốc cho toàn bộ khu đất

- Vẽ đường đồng mức hiện trạng và lập luới đa giác để khống chế mặt bằng khu đất.

a)

b)

Hình 4 : Hiện trạng khu đất được thể hiện theo cách khác

a) Thể hiện bằng đường đồng mức

b)Thể hiện bằng lưới khống chế mặt bằng

-Xác định cao độ, hướng dốc, hướng nước chảy tại một vị trí cụ thể trên bản đồ hiện trạng.

a)


b)

Hình 5 : Hiện trạng khu đất được xem xét tại một vị trí cụ thể

a) Thể hiện hướng nước chảy tại một điểm bất kì trên khu đất

b) Thể diện độ dốc và cao độ tại một vị trí bất kì trên khu đất.

-Tạo mặt cắt địa hình.

a)

b)

Hình 6 : Cắt dọc địa hình

a) Chọn một mặt cắt để thể hiện cắt dọc địa hình

b) Thể hiện cắt dọc địa hình.

2. Xây dựng mạng lưới đường và thể hiện đường đồng mức thiết kế cho đường.

(tiếp theo )

Thứ Tư, 10 tháng 9, 2008

Tạo đường đồng mức cho đường

1. Tạo đường alignment.
có 2 cách tạo đường alignment là tạo từ đường polyline có sẵn hoặc tạo từ layout.Thông thường hay tạo bằng đường polyline hơn.
Sau khi tạo đường alignment tiếp đến là khai báo về kiểu, nhãn, và vận tốc.


2. Tạo một mặt cắt dọc.
từ menu profiles chọn tạo mới một mặt cắt dọc.

Trên bảng trắc dọc tự nhiên vừa tạo, vẽ lên đường trắc dọc thiết kế bằng cách vẽ từ layout trong menu profiles

3. Tạo mắt cắt đường.
Từ menu corridor chọn subassembly tool palettes chọn một mặt cắt đường đã được thể hiện trước trong thẻ assemblies imperial.

4. Tạo tuyến đường có bề rộng từ menu corridors
Sau đó click chuột phải lần lượt chọn các yếu tố mà ta vừa chọn.


Tạo được tuyến đương như sau.


5. Tạo đường đồng mức.

chọn corridor property


chọn surface style sau đó display đường đồng mức lên sau đó chỉnh khoảng cách của các đường đồng mức trong thẻ contours
kết quả

Thứ Tư, 3 tháng 9, 2008

Tạo và sửa đổi Tuyến


A/ Tạo một tuyến bằng những đường chuyển tiếp và đường cong.
Chọn theo đường dẫn để đến với mục chưa file cad trong phần help, mở file Align-1.dwg Sau đó làm theo các hướng dẫn như bài thực hành.
Sau khi click ok sẽ hiễn thị lên 1 tab cho phép chọn các công cụ để tạo tuyến :Curve and Transition Settings .
Thay đổi các thông số trong đó, sau đó chọn
Straight-Straight (With Curves).
Chọn bắt điểm tâm các đường tròn A,B,C,D,E,F rồi nối các điểm lại với nhau.
Kết quả như sau :


B/Tạo đường cong và đường chuyển tiếp tại chỗ gãy


Chọn như trên rồi làm theo hướng dẫn của dòng nhắc lệnh để xử lý điểm gãy tại vòn tròn B


Chọn như trên rồi làm theo hướng dẫn của dòng nhắc lệnh để xử lỹ điểm gãy khúc tại đường tròn C

Kết quả sau khi thay đổi


C/Bắt tiếp đường cong cho tuyến
Vào layout mở layout C-POINTS vào thẻ sau để chọ lệnh


Sau đó làm theo hướng dẫn của dòng nhắc lệnh, ta có được kết quả sau :

Tạo Tuyến Với Alignment Layout Tools

  1. Tạo Alignment Layout có 2 cách chọn menu Alignments Tạo Alignment By Layout hoặc trong dòng nhắc lệnh gõ CreateAlignmentLayout.
  2. Trong hộp Create Alignment - Layout Dialog, điền tên vào một khung tiếp theo được sắp xếp sẵn.
  3. Điền vào ô mô tả tuyến vừa đặt tên.
  4. Điền giá trị tọa độ điểm bắt đầu vào ô starting chainage .
  5. Trong mục General , chỉ rõ các sự lựa chọn như sau:
    • Site :Có thể chọn một tuyến có sẵn hoặc tạo mới
    • Alignment Style
    • Alignment Layer
    • Alignment Label Set
  6. Trong mục Design Criteria , Chọn tốc bộ ban đầu cho tuyến vừa tạo. Tốc độ tuyến có thể thay đổi sau khi tuyến đã tạo xong trong mục Alignment Properties

  7. Chọn Use Criteria-Based Design check box.


    Trong Design Criteria tab, chỉ rõ những lựa chọn sau:

    • Use Design Criteria File

      Chọn một file có sẵn tuyến đã tạo theo đường dẫn của help.

      C:\Documents and Settings\All Users|Application Data\Autodesk\C3D 2009\enu\Data\Corridor Design Standards.
    • Use Design Check Set


  8. Click OK để hiển thị Alignment Layout Tools toolbar.
  9. Sử dụng những lệnh có sẵn trong Alignment Layout Tools toolbar để vẽ thành tuyến.

Thứ Hai, 1 tháng 9, 2008

Autocad Civil 3D User Interface Overview


click here view all image

1.The Menu Brower
Browse all drop-down menus available in civil 3D or perform a real-time search of the menus, menu actions, tooltips, and command prompt text strings.Use the menu browser the browse for recent documents, currently open documents, and command recently exexuted from the menu browser

2.Quick access Toolbar
Store comands that you frequently access in Autocad Civil 3D, By default, you can access New, Open, Save, Plot, Undo, Redo from the Quick Access Toolbar, Add commands to the Quick Access Toolbar using the shortcut menus on the menu browser and toolbar

3.Menus
Menus contain tools and actions for creating and editing Civil 3D objects. The Civil 3D complete workspace contains all menu commands and other workspaces contain specialized subsets of commands.

4.Civil 3D Toolbars
Civil 3D provides a number of toolbar to give you quick access commontly uses commands. The Civil 3D standard provides access to standard operations such as pan and zoom. Other toolbars access provide to transparent commands, feature line commands and inquiry commands.

5.InfoCenter
Search for information using keyword and phrases, display the communication center panel for product updates and unnouncements, or display the favorites panel to access save bookmarks. You can aslo receive information from RSS feeds to quick you subscribe.

6.ViewCube
Display visial feedback of the current orientation of the model or udjust a model’ s viewpoint in a Civil 3D visual style. Restore previous view or click the drag over the rewind wedge scroll through the navigation history to restore a previous view. Enter Cube at the command line to display the ViewCube.

7.Tool Palettes
Organize, share, and place tools that are dragged from your drawing or are provide from your drawing or are provided from Autodesk and third-party developers. Change the properties of any tool palette and organize tool palettes into groups. AutoCad civil 3D include many default palettes including several groupings of subassemblies.

8.Steering Wheel
Access 2D and 3D navigantion tools such as pan, orbit, rewind, and walk from a single inetrface. Start the navigation tools by clicking a wedge or by clicking and dragging the cursor over a wedge. Enter Wheel at the command line to display the Steering Wheel.

9.Workspace Picker
Workspaces are sets of menus and toolbars that are grouped and organized so that you can work in a custom, task-oriented drawing environment. When you use a workspace, only the menus, toolbars, and secondary windows specified in that workspace are shown in the interface.

10.Status Bar
View the coordinate values of your cursor and access several buttons for turning on and off drawing tools as well as many display tools used to scale annotations.

11.Command Line
Execute a command by typing the full command name or command alias at the command prompt and pressing Enter or Spacebar. When Dynamic Input is on and set to display dynamic prompts, you can enter many commands in tooltips near the cursor.

12.Viewport Tabs
Display multiple views of the same drawing, each with different visual styles. Add or remove viewports using the Vports command.

13.List view/ Item view
Use the toolspace item view to display informaton about an item or the content of a collection. The item view is a secondary pade displayed beside or below the tree. To display item view, click the item name.

14.Toolspace
Access the Propector, Settings, Survey, and Toolbox tabs. Use the prospector tab to manager design objects. Use the Settings tab to manage object settings, styles, and other drawing items, such as point file formats, description keu sets and grading criteria sets. Use the survey tab to access reports manager and add custom tools.


Mail to Autodesk company

Dear Webmaster

I’m Cong Thuc Phan. I’m studying in University of Architecture of Ho Chi Minh City, Vietnam. My major is Civil Infrastructure.

As acknowledging the importance of application Autodesk products of your Corp. to the majors of my University, I have an idea about making a forum to share knowledge, experiences and advantages of your softwares’ usage. And that website is free to join. We all see the best products of yours are useful to our majors, such as : AutoCAD, AutoCAD Civil 3D, AutoCAD Land Desktop, Map 3D.

Our forum focuses on : introducing and supplying directions for use of those products to the students. Then they will get the efficiencies in their majors once they exert on those useful softs.

I also expect the impediments if we create that forum : the cost to have a powerful host, the lack of initial linking with your master website and the forums which are operating for similar objects.

Actually, now, those softwares are rather strange to the students of my university. So the forum just introduce and the free legal copy is really hopeful. Besides, we also advertise your softs to more people to show how really useful they are to works.

We have ever attended to your online operating and trainings such as: Autodesk discussion group, web casts, etc. Unfortunately, because our student have some defect of low English grade , most of them couldn’t understand clearly. I think that all will be no more if my requirements are accepted.

As a student, the impediments as I said are really hard to me. If we have your support to establish a forum for our students; I’ll describe carefully about the contents of our new website, what sections will be on, etc.

We surely engage to accept all your terms for establishing a helpful forum efficiently.

Hope your precious reply.

Mr. Cong Thuc Phan – email : kinglove_1122@yahoo.com

Thứ Sáu, 29 tháng 8, 2008

Offsetting a Profile View Label - part 4

This is Part 4 of a series on Profile View Label Styles (PVLS). This post may not make a whole lot of sense if you haven't seen the previous posts in this series. Please take a moment to read them before continuing to read this one. Here's a link to each:


PART 1: Creating Profiles for Labeling Crossing or Connecting Pipe Flowline Elevations

PART 2: Creating the Style for the Connecting Pipe Flowline Elevation Label

PART 3: Labeling the Crossing or Connecting Pipe Flowline Elevations

To use the Offset Style created in this series, you'll need to create the label style first. (Instructions for creating an offset label style can be found Part 2 of this series.

After the style has been created, right click on the style and select New... in the Settings tab of the Toolspace. For Profile Views, this will create a "Child" of the original style. It will have all the same properties and components of the original style at the time that it is created except those that you change.

On the Information tab, rename the text inside the brackets [child] to [RT-0.3]. That means that we will be creating a style that moves the text right 0.3 inches. Go ahead and left click on Apply then select the Layout tab.

Remember how we deleted the original text so that the first component was "Line for Text". This is where it comes into play.

Go to the Line section and change the Start Point X Offset to 0.3, then Apply and OK. Now place the style in the drawing or change one of the existing labels to use this style instead. Here's a screen capture of the original parent style and the new offset RT child style.


There are other ways to change the style as well. Try changing these values and see how they affect the style:

  • The length of the "Line at Insertion Point"
  • The length of the "Line for Text"
  • The Start Point Y Offset of the "Line for Text"
You should never change the values of the "Offset Connection Line", because they will always follow the start/end of the other lines in the style.

Well, that's it for my series on Profile View Label Styles. I hope you found it useful. Feel free to post a comment if you have questions or if you just want to request a topic for a future post.

Creating Profiles for Labeling Crossing or Connecting Pipe Flowline Elevations-part 3

This is Part 3 of a series on Profile View Label Styles (PVLS). You should also read Part 1 and Part 2 of this series for additional information.

To label a crossing and/or connecting pipe flowline elevation, you'll need the style created in Part 2 of this series and profiles for both the main line and the crossing/connecting pipes as described in Part 1 of this series.

After you have the style and profiles created in your drawing, the rest is really simple.

  1. Zoom into the connecting pipe that you want to label.
  2. From the Civil 3d Profile menu, select "Add Profile View Labels", then "Add Profile View Labels...".
  3. In the Add Labels dialog box, select the style that you created from Part 2 of this series (mine was called Connecting Pipe Label).
  4. Choose a Marker style if you want one. I don't generally use one for this style.
  5. Left click on the Add command button.
  6. You will be prompted to select a profile view. Select the profile view by left clicking on one of the grid lines, not the actual profile.
  7. When asked to specify a station, select the endpoint at the flowline of the crossing pipe shown in the profile view.
  8. When asked to specify an elevation, you can either select the same point or specify an elevation for the insertion point of the label.
  9. Repeat this process for other connecting pipe labels that are visible in this profile view.
  10. If you need to add labels in other profile views, you'll need to left click on the Add command button again to select a different profile view.
So now the label is placed, but there aren't any elevations shown. Here's the secret:
  1. Select all the connecting pipe labels in one profile view and then look at the properties listed on the labels. There is a Civil 3D section that contains a listing for Profile1 Object and Profile2 Object. They will be set to by default.
  2. Left click on the for Profile1 Object and set that to the profile you created for the flowline of the main pipe.
  3. Left click on the for Profile2 Object and set that to the profile you created for the crossing and/or connecting pipes and pipe size changes.
Now you have the flowline elevations and all you have to do is editlabeltext on the style to change the name of the utility line and modify the pipe sizes. As I said in my first post, I'm sure you can take this style further to get the pipe sizes in it. Also, you would need to make a copy of the style and modify the text for grade breaks, and crossing pipes.

Well, that's it for Part 3. In Part 4, I will describe how to use the offset capability that we put in place when we created the Profile View Station Elevation Label Style in Part 2 of this series.

Creating Profiles for Labeling Crossing or Connecting Pipe Flowline Elevations-part 2

This is Part 2 of a series on Profile View Label Styles (PVLS). You can view Part 1 of the series here.

Here's the step by step guide to creating the Station Elevation Profile View Label Style. The way this style is created will enable you to easily establish offsets in child styles as needed. That will be explained in a Part 4 of this series.

  1. If toolspace is not visible, type showts at the command line and press enter.
  2. Select the Settings tab.
  3. Double click "Profile View" in the list under your current drawing name.
  4. Double click "Label Styles".
  5. Right click "Station Elevation" and select "New...".
  6. On the Information tab, type a name for your style. I'll use Connecting Pipe Label for this example.
  7. On the General tab, set the layer as required. I'll use PROF-VIEW-TX for this example.
  8. On the Layout tab, delete the default "Station & ELevation" component (yes, the "L" is really capitalized) that is created by clicking on the near the top middle of the Label Style Composer dialog box. I do this because I want a different component to be the first one that appears when the Layout tab is selected in the future.
  9. Select Line from the Create Component dropdown list.
  10. Under the General section:
    1. Change the Name property to Line for Text,
    2. Set the Start point anchor point to Middle Center.
  11. Under the Line section:
    1. Change the Length to 2.0000",
    2. Set the Angle to 270° 00' 00",
    3. Set the Start Point Y Offset to -0.5000". This moves the beginning of the line down 0.5 inches from the point you select for placing the label.
  12. At this point, you're probably looking at the preview side of the Label Style Composer dialog box to see how things are looking. Unfortunately, the default preview state for a Profile View Station Elevation Label is set to Depth Label Style. So click the drop down arrow near the upper right corner of the Label Style Composer dialog box and select "Station Elevation Label Style" to watch the style update as you apply the changes.
  13. At this point, go ahead and select Apply so that everything up to this point will be saved.
  14. Create another line component (same as step 9).
  15. Under the General section:
    1. Change the Name property to Line at Insertion Point,
    2. Set the Start point anchor point to Middle Center.
  16. Under the Line section:
    1. Change the Length to 0.2500",
    2. Set the Angle to 270° 00' 00".
  17. Now create one more line component (same as step 9). This may seem unusual, but it will make sense at the end of the post.
  18. Under the General section:
    1. Change the Name property to Offset Connection Line,
    2. Set the Start point anchor component to Line at Insertion Point,
    3. Set the Start point anchor point to End,
    4. Set the Use End Point Anchor to True,
    5. Set the End Point Anchor Component to Line for Text,
    6. Verify that the End Point Anchor Point is set to Start.
  19. Select Apply again to save the changes up to this point. The preview tab will show that the label currently appears as if there is just one solid line.
  20. Create a text component from the create component list.
  21. Under the General section:
    1. Change the Name property to Station and Flowline Text,
    2. Set the Start point anchor point to Line for Text,
    3. Set the Anchor Point to End.
  22. Under the Text section:
    1. Edit the Contents as follows:
      1. On the format tab, set the Justification to Left,
      2. Insert text appropriate for the style you are creating. For my example, I used this text:
        STA <[Station Value(Uft|FS|P2|RN|AP|Sn|TP|B2|EN|W0|OF)]> SSL-XX=
        STA 1+00 SSL-XX
        FL (XX")=<[Profile1 Elevation(Uft|P2|RN|AP|Sn|OF)]>
        FL (XX")=<[Profile2 Elevation(Uft|P2|RN|AP|Sn|OF)]>
        I also force the XX values to a different color so that I know that these values have to be manually edited and updated as required. It ends up looking something like this:
    2. Set the Attachment point to Bottom Right (Don't ask me why. I think it should be set to Top Left, but once the text is perpendicular to the view, it seems that you have to set it to the opposite of what you think it should be.)
  23. Apply, OK, and your style is complete.
Well, that's it for Part 2. In Part 3, I will describe how to place the Profile View Station Elevation Label Style that you just created.

Creating Profiles for Labeling Crossing or Connecting Pipe Flowline Elevations-part 1

This is Part 1 of a series on Profile View Label Styles (PVLS). I will discuss how to label the flowlines of connecting pipes in a profile view. Armed with this information, you should be able to create your own style that shows flowlines of pipes at crossings and at changes in pipe sizes.

Well this is one label style with which I've been wrestling for some time. Then while creating an offset label style the other day, it just hit me how easy it would be to get the two flowline elevations into one style. Now, at this point, the pipe size in this particular style has to be edited manually, but maybe this style might give you some ideas on how to get everything you want labeled automatically.

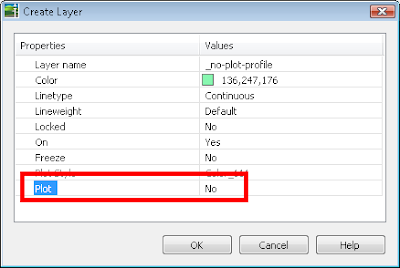
The first thing you need to do is create a profile style with Line, Circular Curve, Symmetrical Parabola, and Asymmetrical Parabola component types visible, but on a "no-plot" layer. For my style, I've create a layer called _no-plot-profile and set the Plot property to "No".


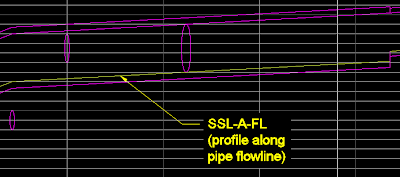
Now create a profile by layout that follows the flowline of the main pipe in your profile view. Be sure to use the "no-plot-profile" style that you just created. This profile can also be used to label your pipe flowline elevations (such as the elevations shown in a band style).


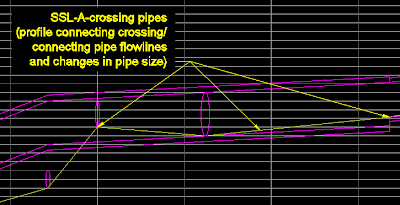
Now create a second profile by layout that connects the flowline of all your crossing or connecting pipes. You can also tag the end of the smaller pipe at a pipe change (since a profile can't be exactly vertical). The second profile should look something like this:


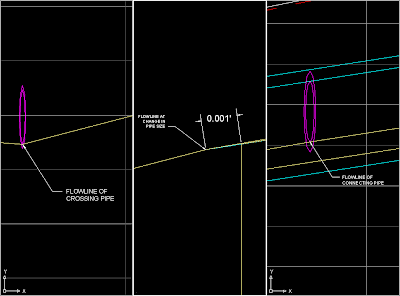
Here's a zoomed in view of the three major locations where I use the "crossing pipe" profile. (Just click on the image to see an enlarged view.)


Well, that's it for Part 1. In Part 2, I will describe how to create the Profile View Station Elevation Label Style.

When you love someone


Click to see the next BRYAN ADAMS image

When you love someone - you'll do anything
you'll do all the crazy things that you can't explain
you'll shoot the moon - put out the sun
when you love someone

you'll deny the truth - believe a lie
there'll be times that you'll believe you can really fly
but your lonely nights - have just begun
when you love someone


when you love someone - you'll feel it deep inside
and nothin' else can ever change your mind
when you want someone - when you need someone
when you love someone...

when you love someone - you'll sacrifice
you'd give it everything you got and you won't think twice
you'd risk it all - no matter what may come
when you love someone... yeah
you'll shoot the moon - put out the sun
when you love someone

Thứ Tư, 27 tháng 8, 2008

Alignment elements in an example (2)

Phần tử tương ứng-Corresponding element

Phần tử tương ứng tại vị trí cố định


Phần tử tương ứng tại vị trí cố định (133) có thể được sử dụng nhiều con số trong các ô chọn được được sắp xếp sẵn. Đó là phần tử chủ yếu được sử dụng như một yếu tố bắt đầu và kết thúc cho các tuyến đơn. Vị trí cố định được xác định dọc tuyến dựa vào phương hướng, và chiều dài. Vị trí nối có thể được vào bằng tay hay lựa chọn từ bản vẽ. Bạn sử dụng F7 để số hóa một điểm nào -hoàn toàn tự động xác định vị trí này. Theo mặc định, phần tử giả thiết phương hướng dọc theo tuyên. Phương hướng có thể nhận biết từ đồ thị bởi việc lựa chọn hay số hóa một điểm.
Phần tử có một chiều dài sai lệch là 0.0004 m. Chiều dài này có thể thay đổi, phụ thuộc vào phần tử theo sau. Ở đây, phần tử tương ứng được điều chỉnh giống như phần tử cố định. Trong trường hợp này, những một tham số bán kính và đường xoắn ốc có thể được chỉ rõ ở đó.


Ví như 99999 được xác định là bán kính, bán kính trong bản điểu chỉnh tham khảo được chấp nhận cho phần tử tương ứng tại vị trí nối. Phần tử tương ứng bởi vậy được bắt đầu bởi việc chạy song song dọc tuyến. Nếu có hai phần tử tương ứng liên tiếp, chúng sẽ tạo nên một khoảng cách dọc tuyến. Ở trường hợp khác, một phần tử tự do phải được đặt giữa chúng.


Ví dụ : phần tử tương ứng tại vị trí cố định


Hình ảnh phác họa


Ở đây, tuyến mới đã được nối tới tuyến tham khảo với hai phần tử tương ứng sao cho nó chạy song song tới tới phần tử tương ứng chạy dọc tuyến khoảng cách 100 m. Phần còn lại của tuyến có thể thiết lập tự do.


Phần tử tương ứng tại vị trí di động


Phần tử tương ứng với một vị trí chuyển động (033) có thể chỉ được sử dụng lúc bắt đầu hay kết thúc thì thành lập tuyến - Luôn luôn kết hợp với một phần tử tự do (032), Phần tử thay đổi (+ 31), hay đường cong hỗn hợp (333).


Trường hợp đặc biệt: Nếu phần tử thay đổi có liên quan được xác định bằng độ dài, phần tử 033 đóng vai trò là một phần tử tương ứng với một vị trí cố định.


Phần tử 033 là một Phần tử có sai số. Nó không xuất hiện trong bảng tính toán cho tuyến


Ví dụ : Phần tử tương ứng tại vị trí chuyển động.


Hình ảnh phác họa


Tuyến mới được bắt đầu với sự chỉ dẫn của tuyến 01. Vì thế một phần ba đường cong kia xem như phần đệm, phần tử tự do liên kết với phần tử tương ứng vị trí chuyển động trên cạnh.


Ưu thế đặc biệt của phần tử tương ứng là có thể đáp trả nhanh chóng để thay đổi. Các tuyến khác nhau có thể tính toán và thay đổi vào bất kì lúc nào.


Phần tử chuyển tiếp-Transition element

Phần tử chuyển tiếp có thể được dùng để chuyển tiếp tự động giữa hai phần tử cố định. Một hoặc nhiều bán kính tự động được phát sinh trong trường hợp này. Có vài tùy chọn để có thể chuyển tiếp.


Chuyển tiếp sử dụng phần tử tự do


Cặp bán kính: Hai bán kính tự động được hợp nhất. Những điểm chính thì được cố định. Điểm tiếp giáp trung gian có thể đượ xác định.


Phần tử tự do với một cặp những bán kính có thể là công việc đầu tiên được sử dụng trong để tìm ra điểm thích hợp. Bước 2, phần tử 232 có thể thay thế bởi một sự kết hợp một phần tử thay đổi và một phần tử tự do.


Chuyển tiếp bởi sự kết hợp giữa phần tử thay đổi và phần tử tự do.


Bán kính Đơn phía trước: Điểm chính của phần tử cố định thì được cố định. Một bán kính đơn đóng vai trò làm đệm. Điểm bắt đầu của việc tiếp nối phần tử cố định sẽ được di chuyển.


Bán kính Đơn lùi: điểm bắt đầu của phần tử cố định thứ hai là một điểm cố định.Ở đó, bán kính đơn là phần đệm lên trên điểm cuối phần tử cố định. Phần tử này di chuyển tương ứng.


Sự chuyển tiếp sử dụng phần tử chuyển tiếp (111 and 112)


Elements 111 + 111

Elements 112 + 112

Elements 111 + 112

Elements 112 + 111